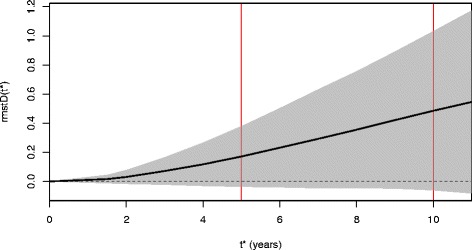
Fig. 4.

Difference in restricted mean survival time estimated using the Pooled Kaplan-Meier method with random effects as a function of the time horizon t * in the MAC-NPC meta-analysis. The solid black line represents the rmstD(t *) plotted as a function of the horizon t *. The dashed horizontal line indicates the absence of a treatment effect (rmstD(t *) = 0). The grey area corresponds to the pointwise 95 % confidence interval. MAC-NPC: Meta-Analysis of Chemotherapy in Nasopharynx Carcinoma; rmstD: difference in restricted mean survival time
