
Fig. 3.
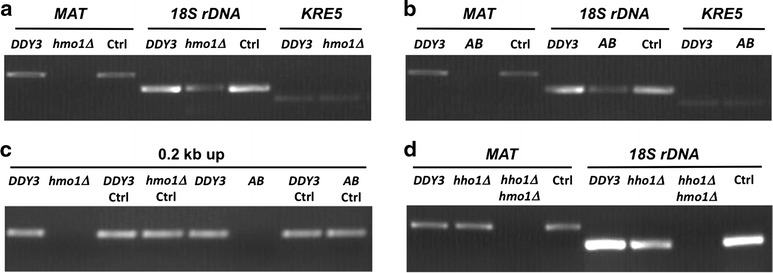
Resistance of chromatin to MNase digestion monitored at specific loci. a, b Amplification of DNA representing MAT, 18S rDNA, and KRE5 after MNase digestion of chromatin isolated from wild-type cells (DDY3) and hmo1∆ (a) or hmo1-AB (b). c Amplification of DNA using primers annealing 0.2 kb upstream of the HO cleavage site within the MAT locus from DDY3, hmo1∆, and hmo1-AB. d Amplification of DNA representing MAT and 18S rDNA from chromatin isolated from DDY3, hho1∆, and hmo1∆hho1∆. In all panels, Ctrl denotes chromatin from the identified strain not incubated with MNase. Data are representative of three repeats