
Fig. 1.
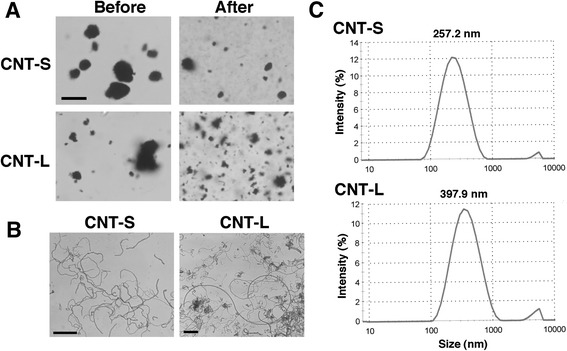
Dispersion of MWCNT agglomerates. MWCNT was suspended in DMEM and sonicated as described in Methods. a Photographs of MWCNT agglomerates before and after the sonication. The particles were observed with a light microscope. Bar = 10 μm. b Photographs of MWCNT fibers. After the sonication, MWCNT was observed with TEM as described in Methods. Bars = 1 μm. c Size distribution of dispersed MWCNT agglomerates. The size distribution was measured with a Zetasizer Nano particle size analyzer (Malvern, Worcestershire, UK)