
Fig. 5.
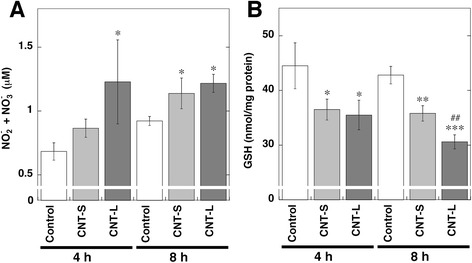
NO release and GSH decrease in MWCNT-treated cells. A549 cells were treated with 1 μg/ml MWCNT for indicated durations at 37 °C. a NO release from MWCNT-treated cells. The concentrations of NO2 - and NO3 - in culture supernatant were measured by the Griess method as described in Methods. b Decrease of GSH contents in MWCNT-treated cells. Intracellular GSH contents were measured with HPLC coupled with an ECD as described in Methods. Data represent means ± SD of 3 independent experiments. *p < 0.05, **p < 0.01 and ***p < 0.001, compared with the control; ## p < 0.01, compared with CNT-S-treated cells by ANOVA followed by Tukey’s test