
Fig. 6.
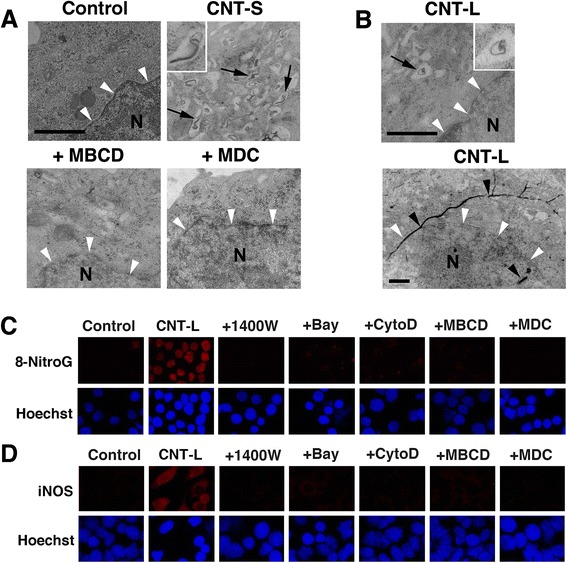
Intracellular distribution of MWCNT and effects of endocytosis inhibitors on inflammatory responses. a Intracellular distribution of CNT-S and effects of endocytosis inhibitors. A549 cells were incubated with 1 μg/ml of CNT-S for 4 h at 37 °C. In certain experiments, the cells were pretreated with 2 mM MBCD or 50 μM MDC for 30 min. Then the cells were observed by TEM as described in Methods. Numerous fibers can be seen in vesicular structures in the cytosol (arrows and inset), but no or few fibers are observed in MBCD- and MDC-pretreated cells. b Intracellular distribution of CNT-L. A549 cells were incubated with 1 μg/ml of CNT-L for 4 h at 37 °C. Only a few fibers are observed in vesicular structures in the cytosol (arrow and inset), and long fibers penetrated the plasma and nuclear membranes (black arrowheads). a, b Bars = 1 μm. N = nucleus. Nuclear membrane is indicated by white arrowheads. Effects of various inhibitors on CNT-L-induced 8-nitroG formation (c) and iNOS expression (d). A549 cells were treated with 1 μg/ml of CNT-L for 8 h at 37 °C in the presence of an inhibitor (1 μM 1400 W, 10 μM Bay, 1 μM CytoD, 2 mM MBCD or 50 μM MDC). Then, fluorescent immunocytochemistry was performed as described in Methods. Hoechst, Hoechst 33258. Magnification, X200