Fig. 5.
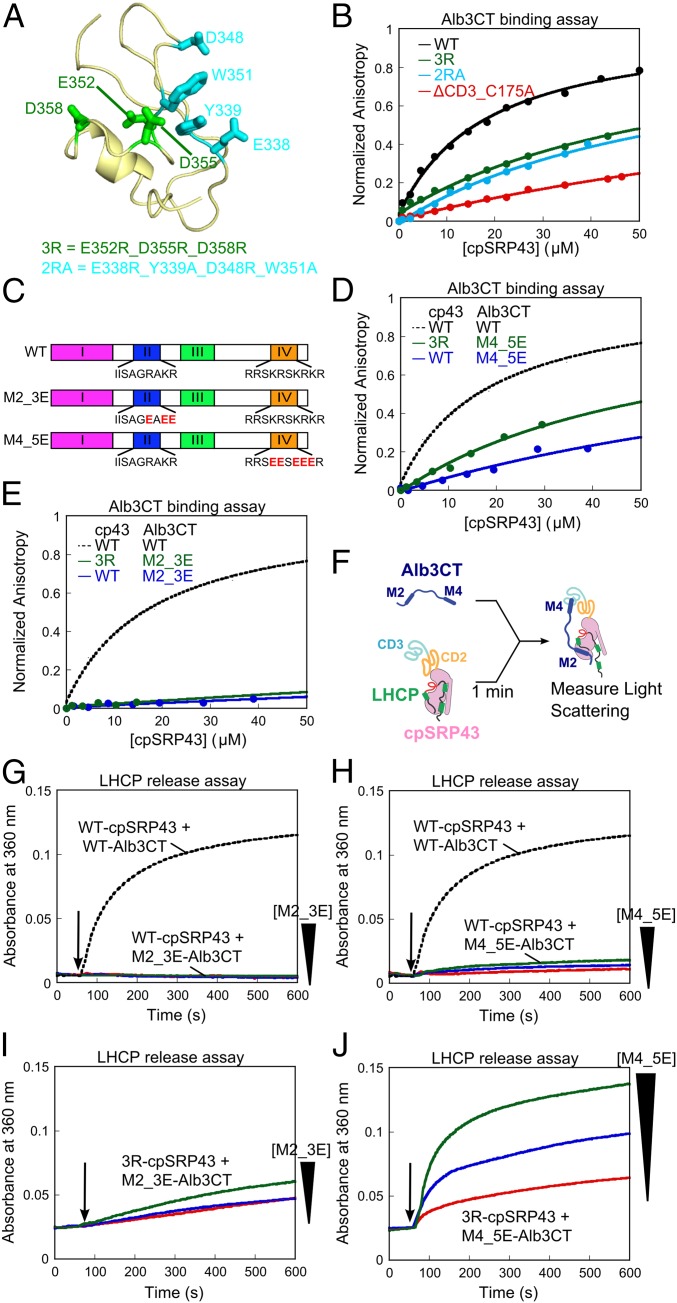
Chromodomain 3 of cpSRP43 binds motif IV of Alb3CT. (A) A structural model of CD3 (PDB ID code 1X32) highlighting the mutated residues. (B) Binding of fluorescein-labeled Alb3CT(S371C) to WT and mutant cpSRP43 were measured by changes in fluorescence anisotropy. The data were fit to Eq. 2 and gave Kd values of 18, >60, >63, and >160 µM for WT cpSRP43 and mutants 2RA, 3R, and ΔCD3, respectively. The anisotropy value of mutants was normalized to the same end point as WT cpSRP43. (C) Schematics of WT and charge reversal mutants of Alb3CT. (D and E) Binding of mutant Alb3CT(M4_5E) (D) and Alb3CT(M2_3E) (E) to WT cpSRP43 and mutant cpSRP43(3R), measured and analyzed as in B. The dashed lines indicate binding between WT Alb3CT and cpSRP43 from B and are shown for comparison. (F) Scheme for the LHCP TMD release assay. M2 and M4 denote Alb3CT motifs II and IV, respectively. (G–J) Alb3CT-induced TMD release from cpSRP43 for the reaction of WT cpSRP43 with mutant Alb3CT(M2_3E) (G), WT cpSRP43 with Alb3CT(M4_5E) (H), mutant cpSRP43(3R) with mutant Alb3CT(M2_3E) (I), and mutant cpSRP43(3R) with mutant Alb3CT(M4_5E) (J). The arrows indicate time of Alb3CT addition. Red, blue, and green indicate addition of 5, 10, and 20 µM Alb3CT, respectively. The dashed lines denote data of WT cpSRP43 with 5 µM Alb3CT and are shown for comparison.

