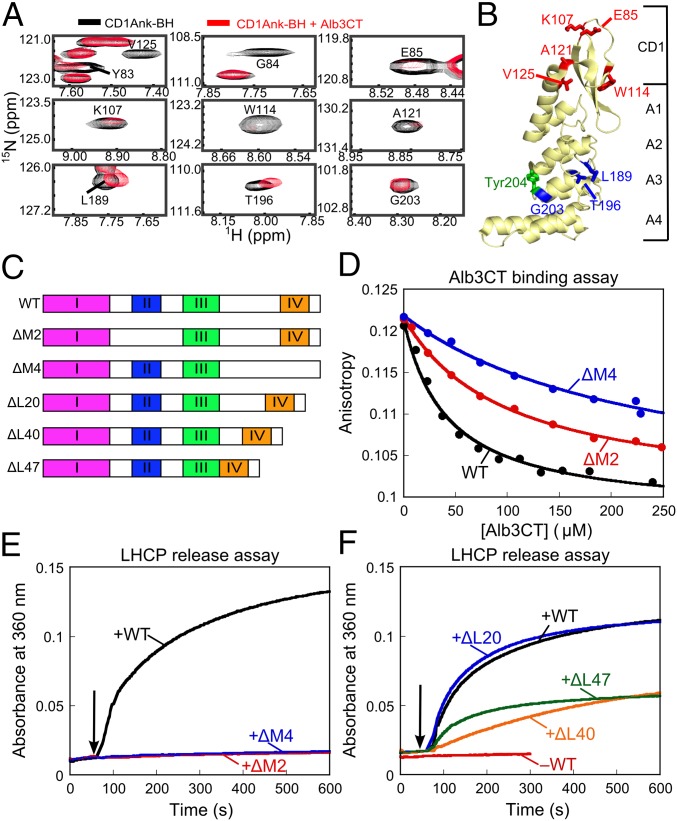
Fig. 6.
Bidentate interaction of Alb3CT with cpSRP43. (A) Alb3CT-induced perturbation of cross-peaks in the TROSY spectra of 2H,15N-labeled CD1Ank-BH fragment. Spectra in the absence and presence of Alb3CT are shown in black and red, respectively. (B) Structure of CD1Ank-BH (PDB ID code 3DEO) highlighting residues for which NMR cross-peaks are perturbed by Alb3CT. Red denotes residues for which cross-peaks are broadened >70%; blue denotes residues whose cross-peaks are shifted by Alb3CT. Green shows Tyr204 in Ank3 where L18 binds. (C) Schematic of the mutant Alb3CT constructs used in this study. ΔM2 and ΔM4 denote deletion of motifs II and IV, respectively, ΔL denotes deletion of linker sequence. (D) Binding of WT Alb3CT (black) and mutant ΔM2 (red) and ΔM4 (blue) to cpSRP43, measured by their ability to compete with fluorescein-labeled Alb3CT(S371C) for binding to cpSRP43 and detected by fluorescence anisotropy. The data were fit to Eq. 3 and gave values of 41, 99, and 237 µM for WT Alb3CT and mutants ΔM2 and ΔM4, respectively. (E and F) LHCP release assays were carried out as outlined in Fig. 5F for WT Alb3CT (black), mutants ΔM2 (red) and ΔM4 (blue) (E), and mutants ΔL20 (blue), ΔL40 (orange) and ΔL47 (green) (F).

