Fig. 1.
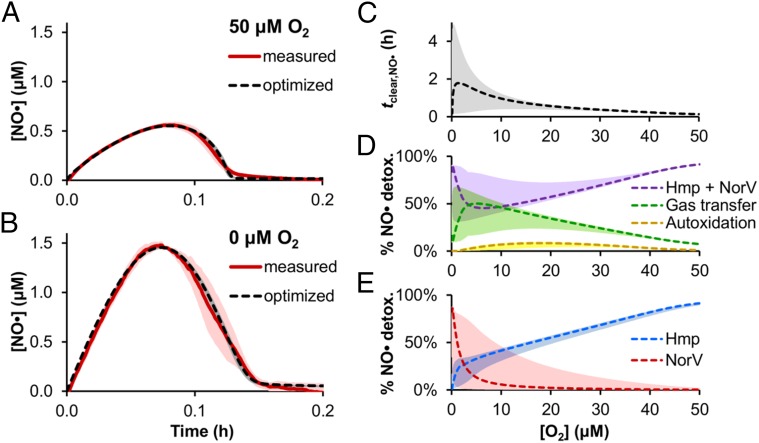
Model training and prediction of NO· clearance throughout the microaerobic regime. Exponential-phase cultures of wild-type (WT) E. coli at an OD600 of 0.05 were treated with 50 μM DPTA NONOate at time t = 0 under conditions of (A) 50 μM O2 or (B) 0 μM O2, and the [NO·] was measured (solid red line; mean of three independent experiments, with light red shading representing the SEM). The model was trained on the measured [NO·] curves at 50 and 0 μM O2, where simulations using the resulting optimal parameter set are plotted (dashed black lines). (C) NO· treatment simulations were run for [O2] environments ranging from 0 to 50 μM O2, from which the time of clearance of NO· (tclear,NO·) was calculated (quantified as the time required for [NO·] to drop below 0.2 μM NO·). (D) Predicted contribution of different NO·-consuming pathways (transfer to the gas phase, autoxidation, and the combination of Hmp- and NorV-mediated detoxification) to the total cumulative detoxification of NO· up to time tclear,NO·. (E) Individual contributions of Hmp and NorV to cumulative NO· detoxification. Dashed lines are simulations using the best-fit (minimum SSR, or ER = 1) parameter set, where shading of similar color represents prediction uncertainty (range of viable parameter sets with ER < 10). The O2 concentration corresponds to the concentration of dissolved O2 in cell-free media that was in equilibrium with the atmosphere of the hypoxic chamber.

