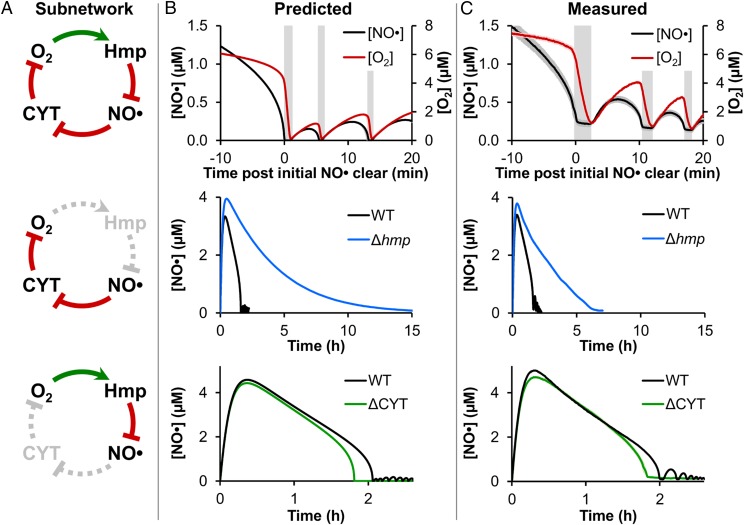
Fig. 3.
Experimental validation of the predicted oscillatory mechanism. (A, Top) Graphical representation of the oscillatory network, where O2 drives Hmp-mediated dioxygenation of NO·, and NO· inhibits CYT reduction of O2. Depiction of how genetic mutants (Middle) Δhmp and (Bottom) ΔCYT impacted the oscillatory network. (B) Predictions and (C) corresponding measurements of (Top) [NO·] and [O2] following treatment of WT E. coli culture with 50 μM DPTA NONOate under a 10 μM O2 environment, showing the region near initial [NO·] clearance (∼1.5 h after DPTA NONOate treatment) when the oscillations begin. Vertical gray bars are to aid visualization of the phase offset between [NO·] and [O2] oscillations, where NO· is depleted first, and then [O2] drops rapidly. (Middle) [NO·] following treatment of WT and Δhmp cultures with 50 μM DPTA NONOate at 10 μM O2, demonstrating the loss of oscillations for Δhmp. (Bottom) [NO·] following treatment of WT and ΔCYT cultures with 50 μM DPTA NONOate at 10 μM O2 (WT culture pH was adjusted to match conditions of ΔCYT; Materials and Methods), demonstrating the elimination of oscillations for ΔCYT. Experimental measurements are the mean of at least three independent experiments, with shading representing the SEM, except for WT [NO·] in the Middle and Bottom, which are representative of at least three independent experiments (the results of which are presented in SI Appendix, Fig. S13 A and D, respectively). Simulations were run using the best-fit parameter set (from optimization “stage 4”), with shading representing prediction uncertainty (range of viable parameter sets with ER < 10).

