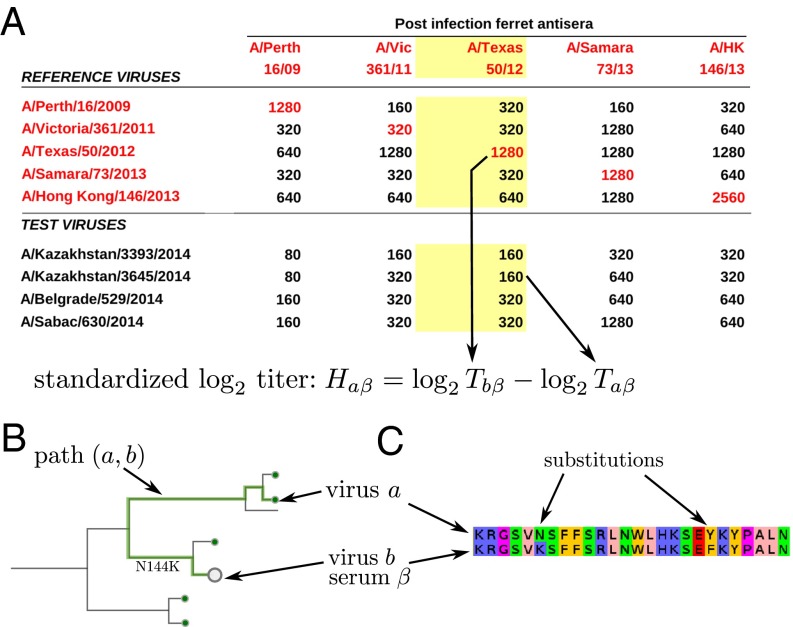
Fig. 1.
Antigenic data and models for HI titers. (A) A typical table reporting HI titer data. Each number in the table is the maximum dilution at which the antiserum (column) inhibited hemagglutination of red blood cells by a virus (row). The red numbers on the diagonal indicate homologous titers. A typical HI assay consists of all reciprocal measurements of the available antisera and reference viruses, and a number of test viruses that are measured against all antisera, but for which no homologous antiserum exists. To make measurements using different antisera comparable, we define standardized log-transformed titers relative to the homologous titer. (B) Each HI titer between antiserum α and virus b can be associated with a path on the tree connecting the reference and test viruses a and b, respectively, indicated as a thick line. The tree model seeks to explain the antigenic differences as additive contributions of branches. (C) In the substitution model, the sum over branches on the tree is replaced by a sum of contributions of amino acid substitutions.

