Fig. S2.
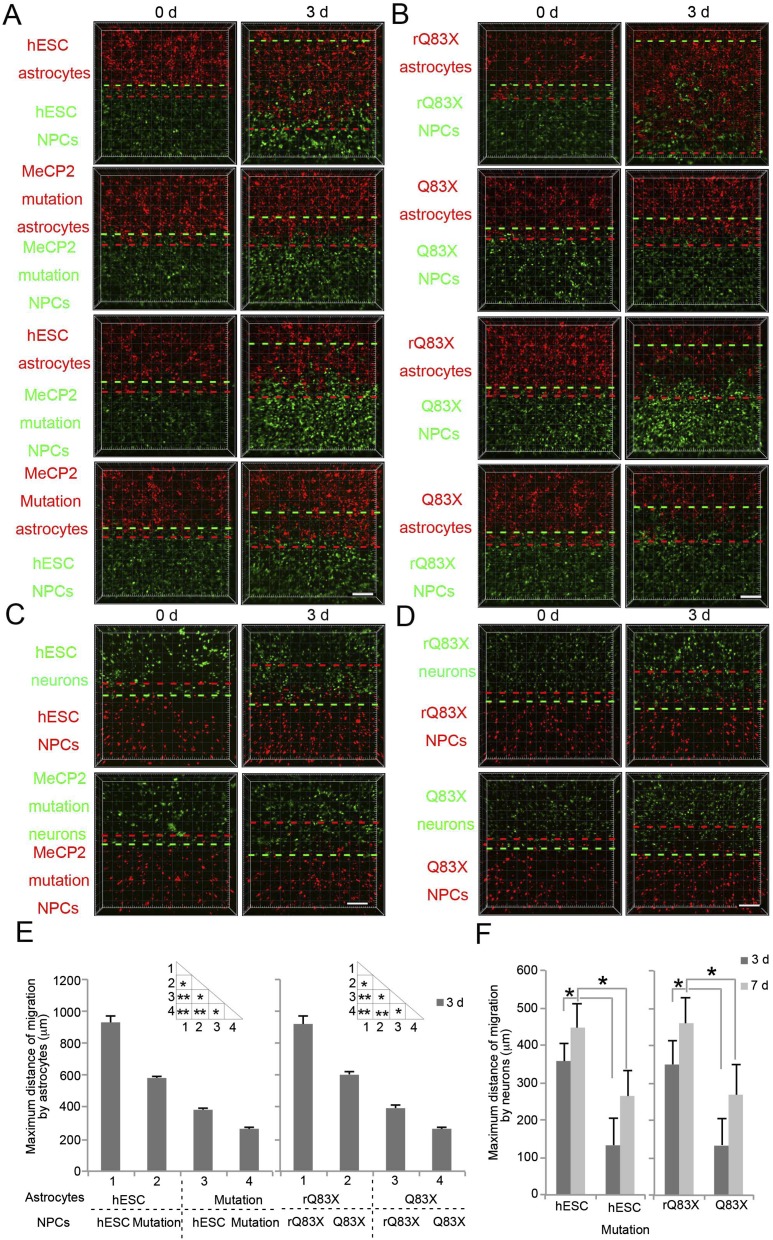
Isogenic cell-derived NPCs mimic migration defect of Q83X NPCs. (A) Representative images of hESC or MeCP2-mutated hESC (hESC–MeCP2 mutation)-derived NPC migration toward astrocytes. (Scale bar, 100 μm.) (B) Representative images of Q83X or patient rescued Q83X (rQ83X)-derived NPC migration toward astrocytes. (Scale bar, 100 μm.) (C) Representative images of hESC or hESC–MeCP2 mutation-derived NPC migration toward neurons. (Scale bar, 100 μm.) (D) Representative images of Q83X or rQ83X-derived NPC migration toward neurons. (Scale bar, 100 μm.) (E) Quantification of maximum migration distance toward astrocytes (see Materials and Methods). Bars represent means; *P < 0.05, and **P < 0.01; n = 3. (F) Quantification of maximum migration distance toward neurons. *P < 0.05; n = 3.

