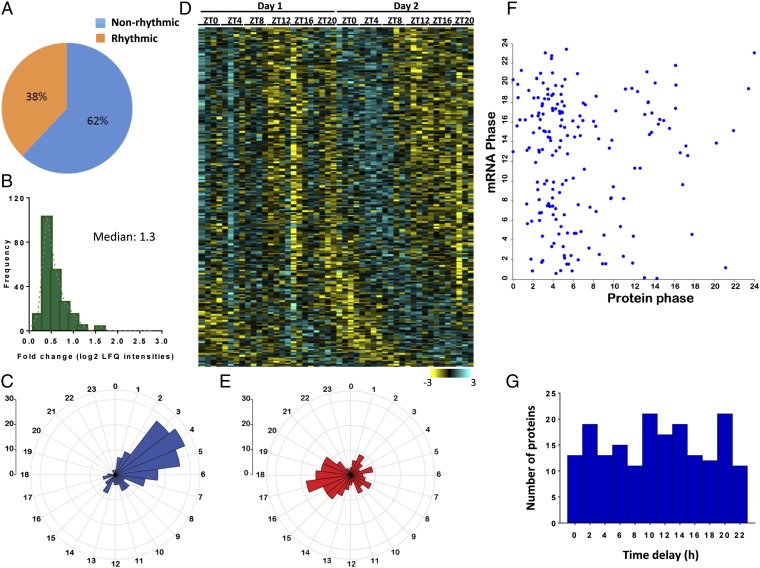
Fig. 1.
Daily oscillations in the mitochondrial proteome. (A) The percentage of annotated mitochondrial proteins that exhibit a diurnal pattern of accumulation. Of 590 quantified and annotated as mitochondrial proteins, 223 proteins exhibited a diurnal pattern of accumulation (38%; 12 time points; n = 4 for each; q value < 0.15). (B) Fold change of rhythmic proteins annotated as mitochondria calculated using the median of the log2 label-free (LFQ) intensities for each time point. The median fold change of the population was 1.3-fold. (C) Phases distribution of the rhythmic proteins annotated as mitochondrial proteins (223 proteins). The y axis on the upper left side indicates the scale of the histogram bins. (D) Hierarchical clustering of rhythmic proteins annotated as mitochondria based on the phase of their maximal expression. Each row corresponds to a protein group entry, and each column indicates the intensities for all of the biological replicates at each time point. The color scale of the intensity values (Z-scored normalized log2 intensities) is shown in the bottom bar [high (light blue) and low (yellow)]. (E) Phase distribution of rhythmic transcripts corresponding to the cycling mitochondrial proteins (185 transcripts). The y axis on the upper left side indicates the scale of the histogram bins. (F) Scatter plot showing the phases for every cycling mitochondrial protein and its corresponding rhythmic mRNA (Pearson correlation r = 0.01). (G) Distribution of the time delays between the peak of the cycling protein and the peak of the corresponding oscillating mRNA.

