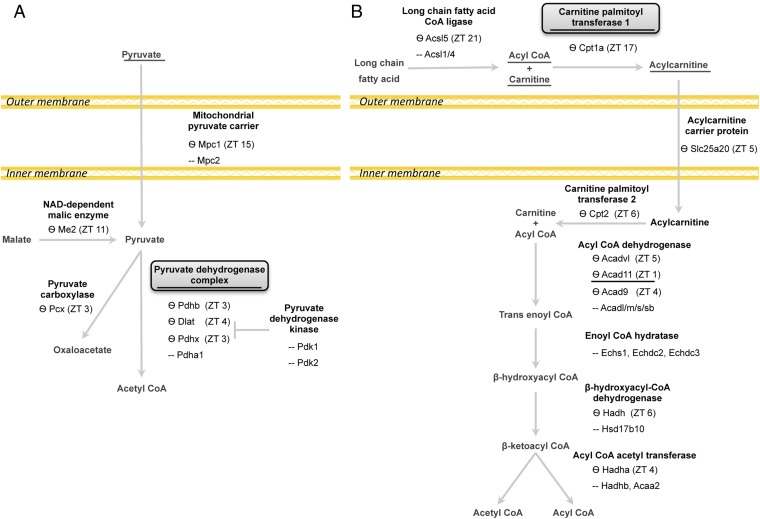
Fig. 2.
Diurnal oscillations of enzymes in pyruvate metabolism and fatty acid uptake and oxidation. Schematic depiction of the following principal mitochondrial pathways: (A) pyruvate metabolism and (B) fatty acid uptake and FAO. Metabolites are marked in gray, and enzymes are in black; known rate-limiting enzymes are shown as squares. Oscillating enzymes according to the proteomics analysis are marked with a wave sign (Ѳ) together with their peak time indicated by ZT. Metabolites used as substrates for mitochondrial respiration assays in Figs. 4 and 5 and relevant enzymes are underlined.

