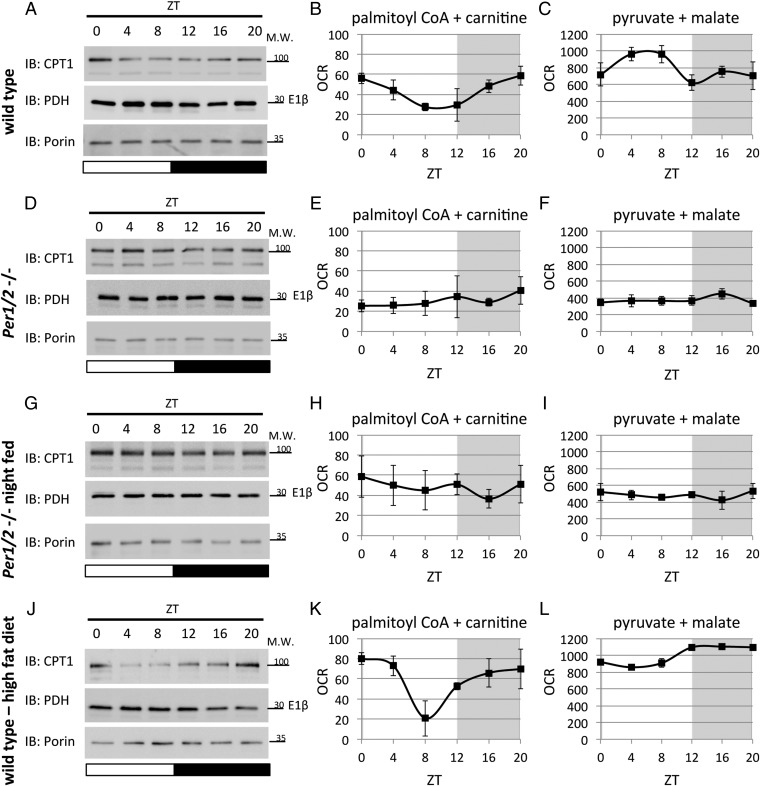
Fig. 4.
Daily oscillations in accumulation of rate-limiting mitochondrial enzymes and mitochondrial respiration are PER1/2-dependent. (A) Mitochondrial protein extracts of WT mice fed ad libitum were analyzed by SDS/PAGE and immunoblot (IB) with indicated antibodies. Oxygen consumption rates (OCRs) of isolated mitochondria prepared from WT mice fed ad libitum were quantified using the Seahorse Flux Analyzer in the presence of the indicated substrates: (B) palmitoyl CoA and carnitine and (C) pyruvate and malate. (D) Mitochondrial protein extracts of PER1/2 null mice fed ad libitum were analyzed by SDS/PAGE and IB. OCRs of isolated mitochondria prepared from PER1/2 null mice fed ad libitum were quantified in the presence of the indicated substrates: (E) palmitoyl CoA and carnitine and (F) pyruvate and malate. (G) Mitochondrial protein extracts of night-fed PER1/2 null mice were analyzed by SDS/PAGE and IB. OCRs of isolated mitochondria prepared from night-fed PER1/2 null mice were quantified in the presence of the indicated substrates: (H) palmitoyl CoA and carnitine and (I) pyruvate and malate. (J) Mitochondrial protein extracts of WT mice fed with a high-fat diet for 3 d were analyzed by SDS/PAGE and IB. OCRs of isolated mitochondria prepared from WT mice fed with a high-fat diet for 3 d were quantified in the presence of the indicated substrates: (K) palmitoyl CoA and carnitine and (L) pyruvate and malate. Carbonilcyanide p-trifluoromethoxyphenylhydrazone (FCCP) was specifically added in the case of pyruvate and malate according to standard protocols as detailed in Materials and Methods. For SDS/PAGE and IB, porin levels were used as a loading control, and each time point consists of a mix of mitochondria isolated from three to four individual mice (Fig. S4 shows quantification of the different IBs). OCR measurements are presented in picomoles per minute as means ± SEMs, with individual measurements of three to five animals per time point. Gray shading represents the dark phase. Molecular mass (M.W.) is indicated in kilodaltons.

