Fig. 5.
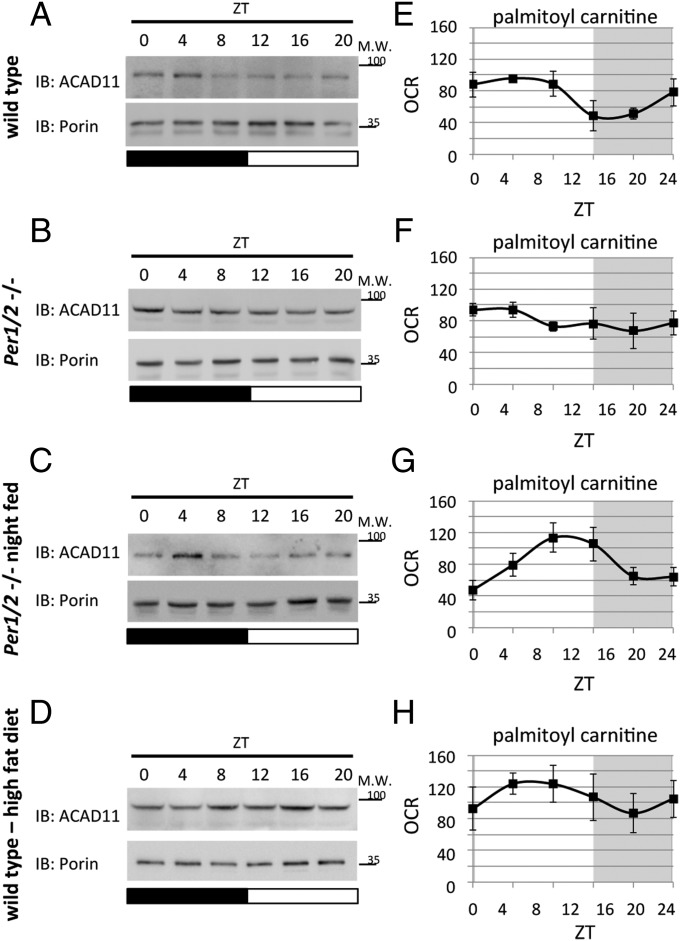
Analysis of FAO in WT and PER1/2 null mice under different feeding regimens. Mitochondrial protein extracts were analyzed by SDS/PAGE and immunoblot (IB) with indicated antibodies. (A) WT mice fed ad libitum. (B) PER1/2 null mice fed ad libitum. (C) Night-fed PER1/2 null mice. (D) WT mice fed with a high-fat diet for 3 d. Oxygen consumption rates (OCRs) of isolated mitochondria in the presence of palmitoyl carnitine and malate were quantified using the Seahorse Flux Analyzer. (E) WT mice fed ad libitum. (F) PER1/2 null mice fed ad libitum. (G) Night-fed PER1/2 null mice. (H) WT mice fed with a high-fat diet for 3 d. For SDS/PAGE and IB, porin levels were used as a loading control, and each time point consists of a mix of mitochondria isolated from three to five individual mice (Fig. S4 shows quantification of the different IBs). OCR measurements are presented in picomoles per minute as means ± SEMs, with individual measurements of three to five animals per time point. Gray shading represents the dark phase. Molecular mass (M.W.) is indicated in kilodaltons.

