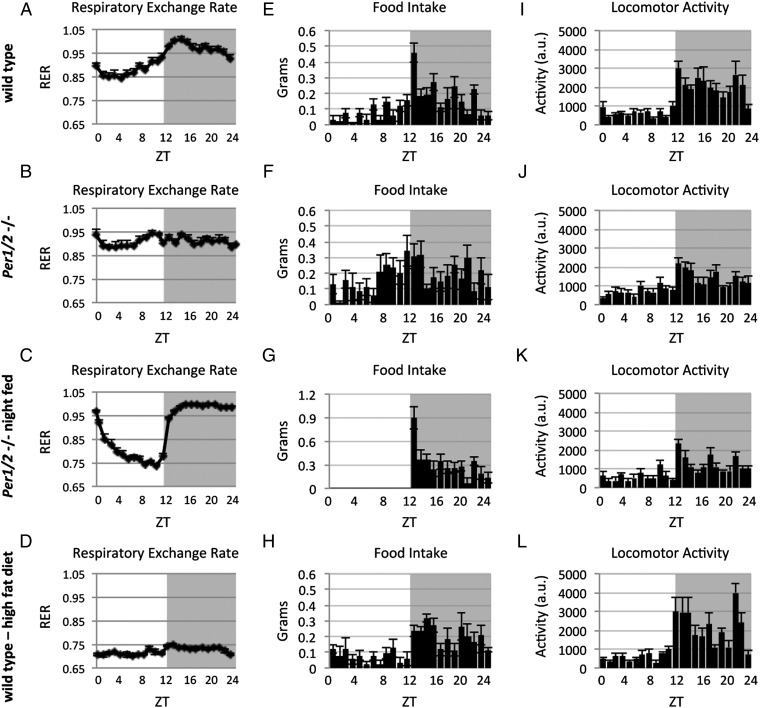
Fig. 6.
Analysis of RER, feeding behavior, and locomotor activity of WT and PER1/2 null mice under different feeding regimens. RER, food consumption, and voluntary locomotor activity were recorded using metabolic cages. (A) RER of WT mice fed ad libitum. (B) RER of PER1/2 null mice fed ad libitum. (C) RER of night-fed PER1/2 null mice. (D) RER of WT mice fed with a high-fat diet for 3 d. (E) Food consumption of WT mice fed ad libitum (29.3% and 70.7% during the light and dark phases, respectively; n = 7; P value = 1E-05). (F) Food consumption of PER1/2 null mice fed ad libitum (44.8% and 55.2% during the light and dark phases, respectively; n = 8; P value = 0.01). (G) Food consumption of night-fed PER1/2 null mice. (H) Food consumption of WT mice fed with a high-fat diet for 3 d (26.7% and 73.3% during the light and dark phases, respectively; n = 4; P value = 6E-06). (I) Locomotor activity of WT mice fed ad libitum (23.6% and 76.4% during the light and dark phases, respectively; n = 7; P value = 1E-07). (J) Locomotor activity of PER1/2 null mice fed ad libitum (33.1% and 66.9% during the light and dark phases, respectively; n = 8; P value = 7E-05). (K) Locomotor activity of night-fed PER1/2 null mice (31% and 69% during the light and dark phases, respectively; n = 8; P value = 2E-04). (L) Locomotor activity of WT mice fed with a high-fat diet for 3 d (22.7% and 77.3% during the light and dark phases, respectively; n = 4; P value = 1E-04). Data are presented as means ± SEMs, with individual measurements of four to eight animals per time point. Locomotor activity is presented in arbitrary units (a.u.). Gray shading represents the dark phase.

