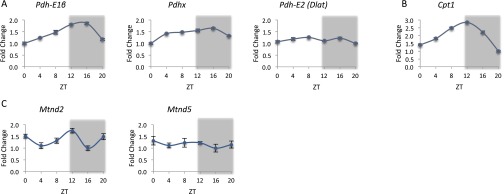
Fig. S3.
Daily expression profiles of enzymes participating in mitochondrial nutrient processing. WT mice fed ad libitum were killed at 4-h intervals throughout the day. Total RNA was prepared from liver, and mRNA expression levels of enzymes participating in mitochondrial nutrient processing were determined by quantitative real-time PCR and presented as fold change relative to the lowest value, with means ± SDs of four mice per time point. (A) Pdh-E1β, Pdhx, and Pdh-E2 (Dlat). (B) Cpt1. (C) Mtnd2 and Mtnd5. Gray shading represents the dark phase.

