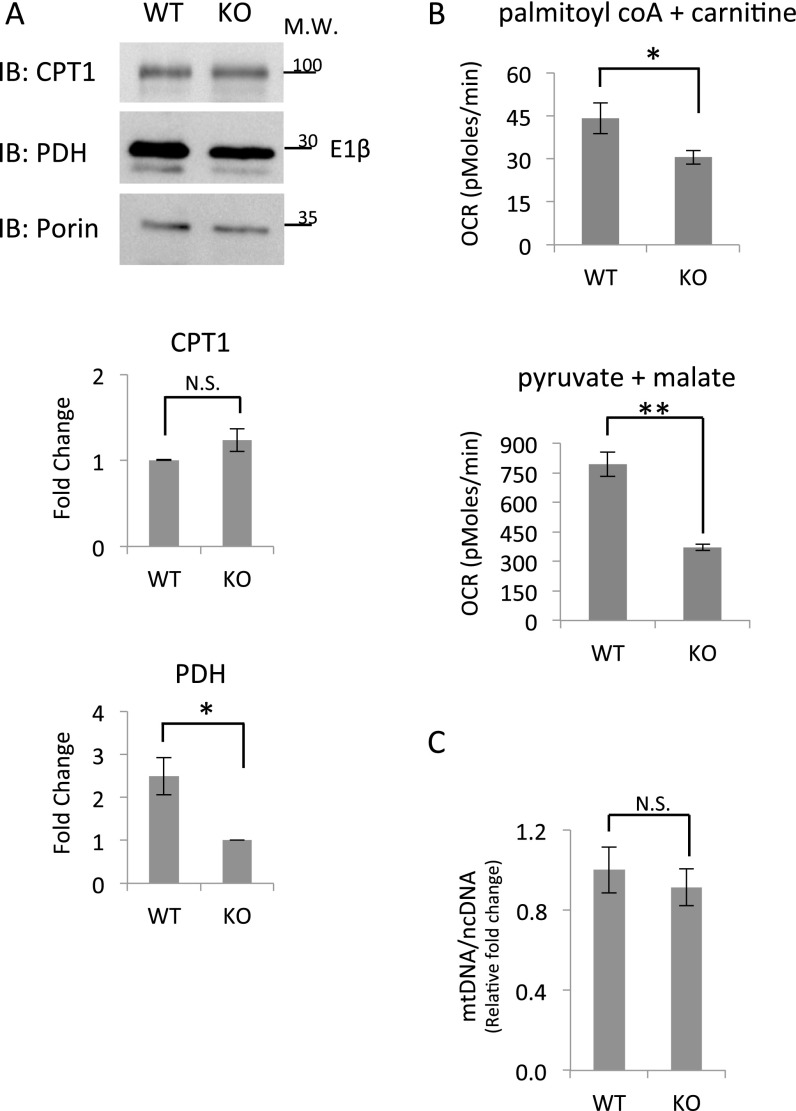
Fig. S6.
Comparison of daily mean CPT1 and PDH protein levels, mitochondrial respiration, and the number of mitochondria in WT and Per1/2−/− mice. (A) Mitochondrial protein extracts of WT and Per1/2−/− mice (KO) fed ad libitum were analyzed by SDS/PAGE and immunoblot (IB) with indicated antibodies. Porin levels were used as a loading control, and each condition consists of a mixture of all six time points throughout the day, with mitochondria isolated from three to four individual mice for each time point. CPT1 and PDH-E1β levels were quantified relative to porin levels. Data are presented as fold change relative to the lowest value, with means ± SEMs of three independent experiments. (B) Oxygen consumption rates (OCRs) of isolated mitochondria from WT and Per1/2−/− mice (KO) fed ad libitum were measured in the presence of palmitoyl CoA and carnitine or pyruvate and malate. Carbonilcyanide p-trifluoromethoxyphenylhydrazone (FCCP) was added in the case of pyruvate and malate according to standard protocols as detailed in Materials and Methods. For each condition, data are presented in picomoles per minute as means ± SEMs of all six time points throughout the day, with three to four individual mice for each time point. (C) The average ratio of mtDNA to nuclear DNA (ncDNA) in WT and Per1/2−/− mice (KO) fed ad libitum was quantified by real-time PCR as described in Materials and Methods. Data are presented as fold change relative to the highest value, with means ± SEMs of n = 4. Molecular mass (M.W.) is indicated in kilodaltons. N.S., nonsignificant. *P value < 0.05; **P value < 0.001.

