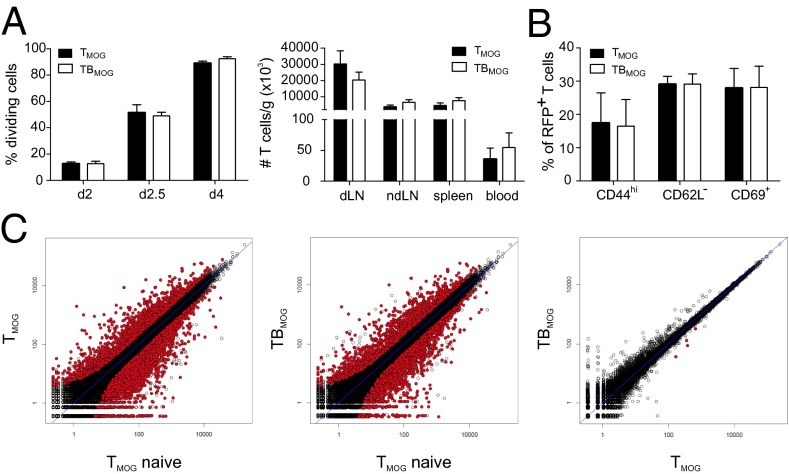
Fig. 2.
TMOG cell priming is not changed in the presence of BMOG cells. TMOG cells in the draining LNs were analyzed (A and B) in the priming phase (day 2–4 p.i.) or (C) from the spleen briefly before disease onset at day 9 p.i. (A) TMOG cell proliferation in draining LNs of T-/B-MOG (TBMOG) and T-MOG (TMOG) mice. (Left) Percentage of dividing cells analyzed by flow cytometry of TMOG-RFP cells labeled by carboxyfluoresein succinimidyl ester (CFSE) as mean ± SEM. n = 6–10. (Right) Absolute numbers of TMOG-RFP cells at day 4 p.i. Mean ± SEM. n = 5–10. (B) Analysis of activation markers. TMOG-RFP cells analyzed at day 4 p.i. for the indicated membrane proteins by flow cytometry (% of positive TMOG-RFP cells). n = 4. (C) RNAseq transcriptome analyses. Transcriptomes of effector TMOG cells sorted from spleens of T-MOG and T-/B-MOG mice 9 d p.i. were compared with each other and also with nonprimed TMOG cells (n = 3). Gene expression levels of effector T cells from T-MOG mice plotted against those of T-/B-MOG mice (Right) or naive TMOG cells (Left) or T-/B-MOG mice-derived effector TMOG cells vs. naive TMOG cells (Center). Differentially expressed genes (red).

