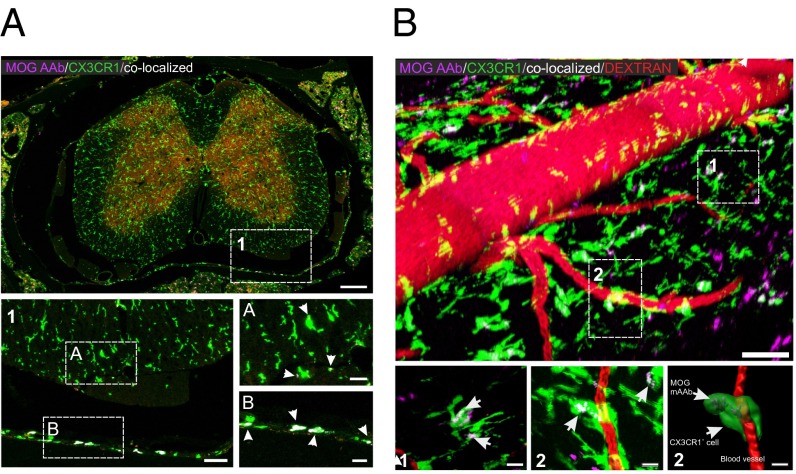
Fig. 4.
Binding of MOG mAAb to CNS macrophages/microglia. (A) Confocal analysis of a spinal cord section of MOG-immunized CX3CR1-EGFP mice at day 8 p.i. SeTau-647–labeled MOG mAAb had been injected i.v. on day 7. Arrows indicate colocalization of CX3CR1-EGFP+ cells with MOG mAAb (colocalization appears in white). Note that the colocalization signal is more pronounced with meningeal macrophages than with microglia. Green, CX3CR1+ cells; red, TMOG cells; magenta, SeTau-647–labeled MOG antibody. [Scale bars: overview picture (Top), 200 µm; higher magnification (1), 50 µm; and Insets A and B, 20 µm. (B) Intravital 2-PM imaging of naive CX3CR1-EGFP mice 24 h after i.v. injection of MOG mAAb. (Scale bars: overview, 70 µm; scale bar zoom-ins, 15 µm.) Shown is 70-kDa Texas Red dextran (red) for visualization of blood vessels. Green, CX3CR1+ macrophages and microglia; magenta, SeTau-647–labeled MOG mAAb. Arrows indicate colocalization of the MOG mAAb with macrophages or microglia (white). (Bottom Right) A 3D reconstruction of the cell in region 2 using Imaris software.

