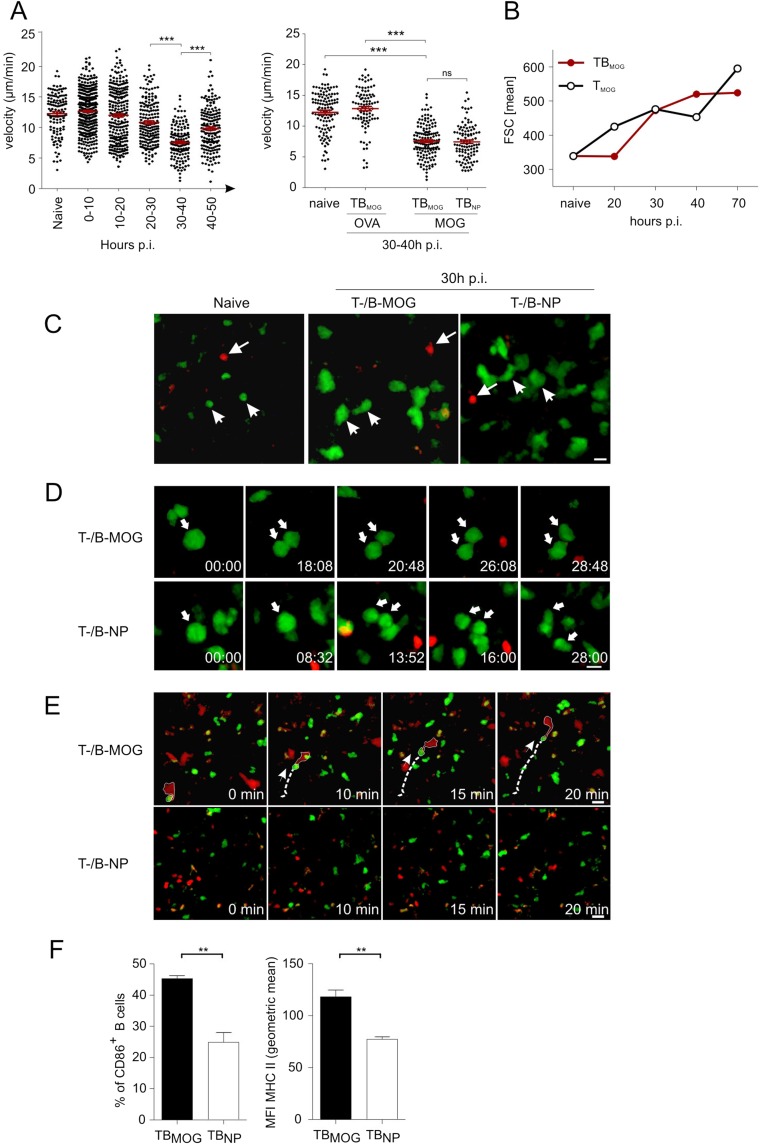
Fig. S2.
Locomotion properties of TMOG cells in the presence of BMOG cells in draining LNs. (A) Intravital 2-PM recording of the mean 3D velocity of TMOG-GFP cells in the draining LN. (Left) Kinetics of the mean 3D velocity of TMOG-GFP cells at the indicated time points p.i. with MOG. naïve, before immunization. Individual data points representing trajectories from single cells were grouped in 10-h intervals and are presented as mean ± SEM. (Right) T-cell velocity during the priming phase in the presence/absence of BMOG cells. 2-PM recordings of the TMOG-GFP cells in draining LNs of T-/B-MOG mice before (naive) and 30–40 h p.i. with OVA or MOG and in T-MOG/B-NP mice immunized with MOG. Statistical analyses: one-way ANOVA nonparametric Kruskal–Wallis test, followed by Dunn’s multiple comparison test. ***P < 0.001. All data are presented as mean ± SEM. (B) T-cell enlargement during priming is independent of BMOG cells. Cell size of TMOG-GFP cells in the draining LNs of T-/B-MOG compared with T-MOG mice at the indicated time points p.i was analyzed by cytofluorometry. naive, no immunization. (C) Size increase of TMOG-GFP cells was analyzed in the draining popliteal LN 30 h p.i. in T-/B-MOG (Middle) and T-MOG/B-NP mice (Right) in comparison with naive mice (Left). Arrows heads point to TMOG-GFP cells. Arrows indicate BMOG-RFP or BNP-RFP cells. (Scale bar: 10 µm.) Red, BMOG or BNP cells; green, TMOG cells. (D) Proliferation of TMOG-GFP cells. Kinetic of representative TMOG-GFP cell mitosis at 30 h p.i. (arrow) in T-/B-MOG mice (Upper) and T-MOG/B-NP mice (Lower). (E) TMOG cells form motile conjugates with BMOG but not with BNP cells. A representative TMOG-BMOG-pair (Upper) is outlined at a time point 20–30 h p.i. The dashed line indicates the migration path, and the arrow the direction of the motile T-B conjugate. Interactions were not detected between TMOG and BNP cells (Lower). (Scale bar: 15 µm.) Green, TMOG cells; red, BMOG or BNP cells. (F) BMOG cell activation in the draining LN indicated by CD86 and MHC class II up-regulation. BMOG cells were compared with BNP cells at day 3d p.i. with MOG. Data are presented as mean ± SEM, n = 3.

