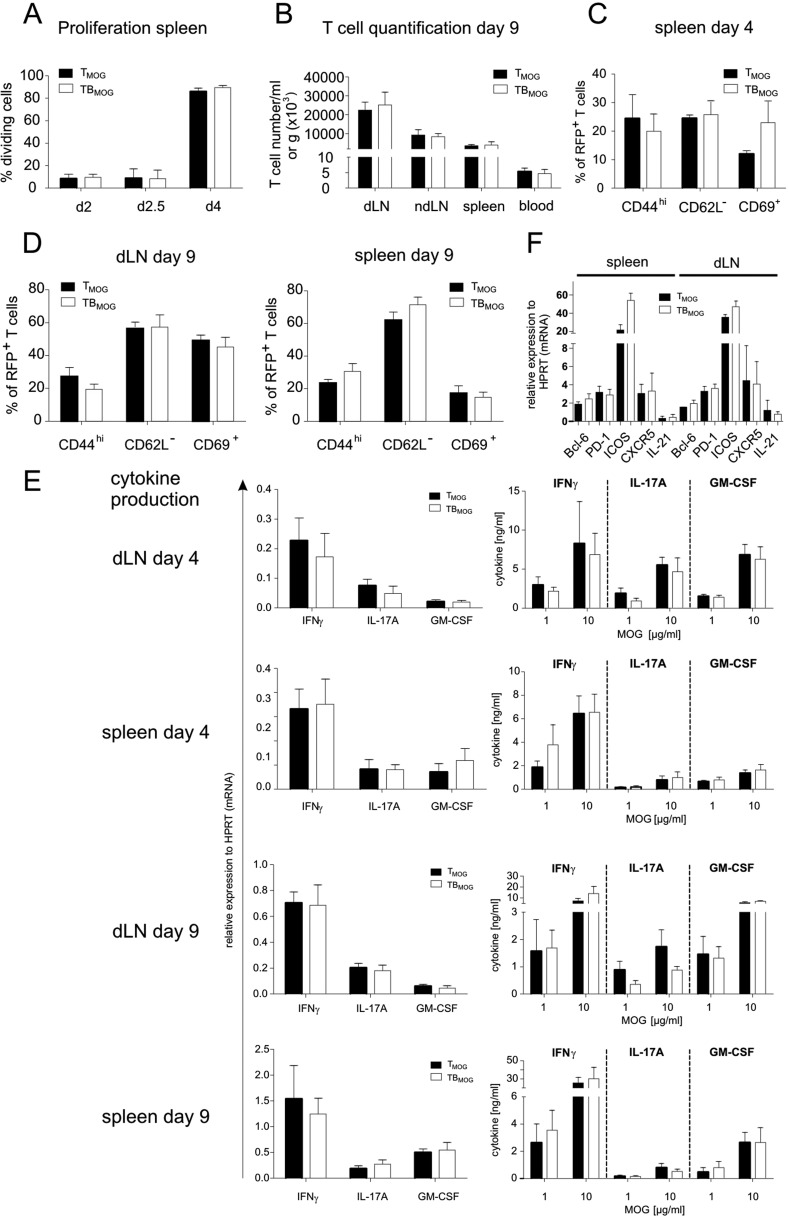
Fig. S3.
TMOG cell priming in the secondary lymphoid organs is not changed in the presence of BMOG cells. TMOG cell activation was analyzed during the priming phase (days 2–4 p.i.) or briefly before disease onset at day 9 p.i. (A and B) TMOG cell proliferation. (A) Proliferation of TMOG cells in the spleen of T-/B-MOG and T-MOG mice at the indicated time points. Data are presented as the percentage of dividing TMOG cells (CSFE dilution). Mean ± SEM, n = 6–10. (B) Numbers of TMOG-RFP cells at day 9 p.i. in the indicated organ per gram of tissue or per milliliter of blood. Data are presented as mean ± SEM. n = 4–5. (C and D) Expression of membrane activation markers in TMOG cells at days (C) 4 or (D) 9 p.i. analyzed by flow cytometry. The percentage of positive TMOG cells is depicted as mean ± SEM, n = 4. (E) Cytokine production evaluated by quantitative PCR in ex vivo-sorted TMOG-RFP cells (Left) or by ELISA stimulated in vitro with the indicated amounts of MOG35–55 (Right). Cytokine production was assessed at the indicated days p.i. from the draining lymph node (first and third rows) or the spleen (second and fourth rows). Data are presented as mean ± SEM and represent four to six animals per group. (F) Expression of genes of the TFH program. Expression levels of the genes coding for Bcl-6, PD-1, ICOS, CXCR5, and IL-21 were analyzed at day 4 p.i. Data for the spleen or draining lymph nodes are presented as mean ± SEM. n = 4.

