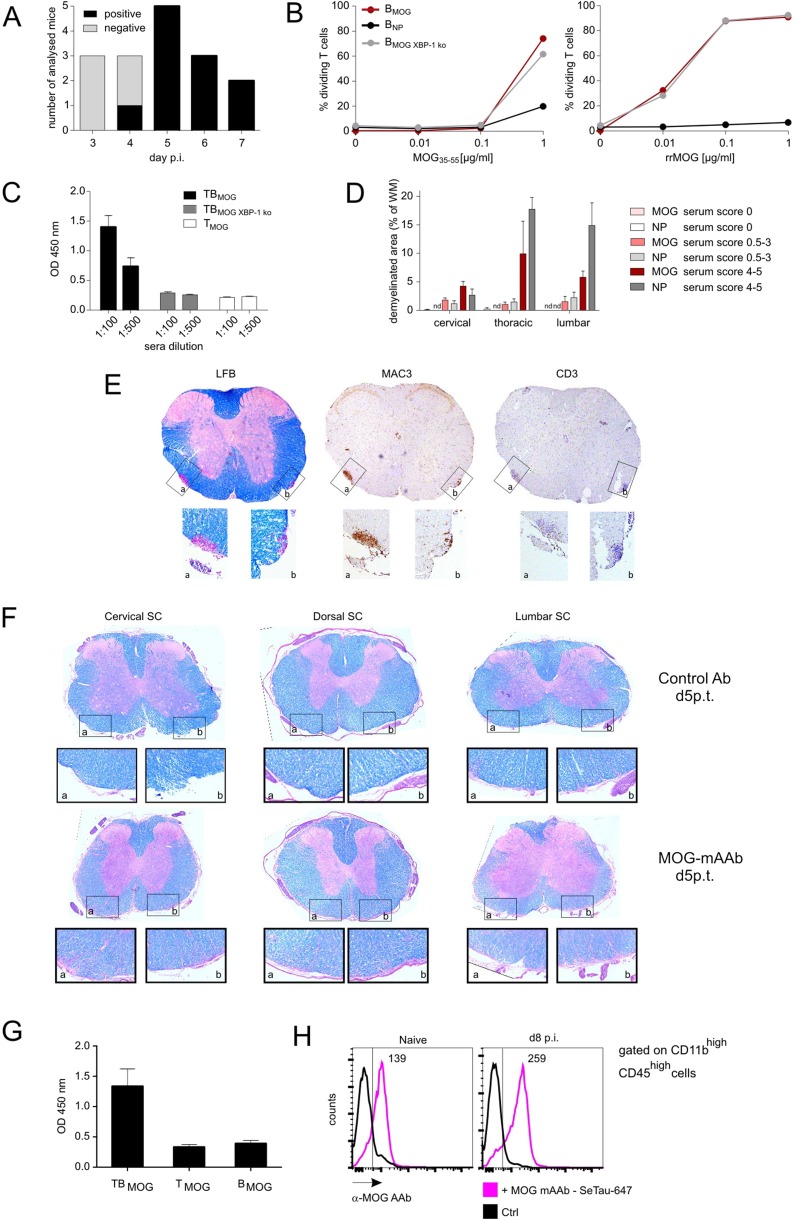
Fig. S5.
MOG-specific AAbs appear in vivo at day 4–5 p.i. but do not cause severe demyelination in preclinical CNS lesions independently of inflammation. (A) Antibody production capacity of BMOG cells in vivo. MOG AAb production (IgG) was tested at the indicated time points p.i. with MOG by ELISA. Sera were considered positive with an OD of >0.45 (mean ± 3 SD from control sera). Data are presented as positivity of different mice per day, with two to five mice analyzed per time point. Note that, to exclude production of MOG AAb by endogenous B cells, the BMOG cells were transferred in B-NP mice. (B) BMOG cells deficient in XBP-1 present antigen to TMOG cells but are incapable of producing MOG AAb. Proliferation of TMOG cells cocultured in vitro together with BMOG cells, BNP cells, or XBP-1–deficient BMOG cells (BMOG XBP-1 ko) in the presence of MOG35–55 (Left) or rrMOG (Right) assessed by CFSE dilution. One representative experiment of at least two is shown. (C) MOG AAb IgG titers in T-/B-MOG, T-/B-MOGXBP-1ko, or T-MOG mice at 2.5 wk p.i. in the indicated dilutions. Data are presented as optical density (mean ± SEM), n = 12. (D–F) MOG AAb in preclinical CNS lesions do not cause severe demyelination, and lesions are characterized by inflammation rather than demyelination. (D) Demyelination was quantified in the indicated spinal cord regions from mice that had received i.t. MOG AAb or NP Ab sera at day 8 p.i. Data are presented as demyelinated area as percentage of white matter (mean ± SEM) with mice grouped according to the clinical scores in the time frame of 24–48 h after antibody injection. n = 3–6. n.d., not detectable. Note that, 12 h p.i., no clinical signs and no demyelination could be detected. (E) MOG AAb-induced demyelinating lesions are characterized by inflammatory infiltrates. Histological analysis of a demyelinated lesion of the thoracic spinal cord from a MOG AAb-treated mouse (preclinical phase). The sections are stained with luxol fast blue (LFB), anti-macrophages (MAC3), and anti–T-cell (CD3) antibodies. (Magnification: Overview (Top), 4x; Bottom Insets, 20×.) Note that demyelinated regions are circumscribed and characterized by dense T-cell and macrophage infiltrates. (F) MOG mAAb treatment does not cause demyelination in rat EAE. The i.t treatment with MOG mAAb or isotype control Ab was performed in Lewis rats 3.5 d after TMOG cell transfer. Histological analysis of spinal cord (SC) at the indicated levels from a control or a MOG mAAb-treated animal 5 d p.t. The sections were stained with luxol fast blue. (Magnification: Overview (Top), 4×; Bottom Insets, 10×.) Note that no signs of demyelination were observed. (G and H) Occurrence of MOG AAbs in the CSF and binding of MOG mAAb to CNS macrophages/microglia. (G) MOG AAbs are present in the CSF during the preclinical phase. CSF was collected at day 9 p.i. from T-MOG mice, T-/B-MOG mice, and B-MOG mice. The presence of MOG AAb (IgG) was tested by ELISA (dilution 1:100). Data are presented as OD450 ± SEM, n = 2–4. (H) MOG AAb is localized in meningeal CD11bhighCD45high cells. SeTau-647–labeled MOG mAAb was injected i.v. into naive or MOG-immunized mice on day 7 p.i. Cells were isolated at day 8 p.i. from the meninges and analyzed by flow cytometry, gated successively for lymphocytes and CD11bhighCD45high cells. Histograms for SeTau-647 are shown; numbers indicate mean fluorescence intensity (MFI). Representative data of two independent experiments with n = 2 per experiment and per group.

