
Table S1.
BMOG cells trigger/aggravate clinical disease
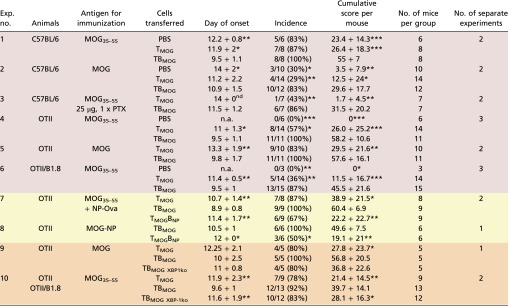 |
Data are presented as mean ± SD. For the day of onset and the cumulative score per mouse, the result of the statistical test (Mann–Whitney U test) is indicated against the group receiving B cells. Differences in the incidence are calculated using the χ2 test. *P < 0.05, **P < 0.01, ***P < 0.001. The cumulative score per mouse is calculated as the area between the clinical score curve and the x axis from every mouse in the group over the entire observation period, which was kept constant for all mice of all groups within the experiment. The color code is as follows: red, basic observation with transfer of TMOG and TBMOG cells into different hosts; yellow, experiments including B cells of different specificities (NP) to test the effects of unspecific activation; orange, experiments including BMOG cells deficient in XBP-1. MOG, rrMOG protein; MOG35–55, MOG peptide amino acids 35–55; n.a., not applicable; nd, not determined (a statistical evaluation could not be performed due to the fact that in one group only one mouse developed clinical disease).