
Table S2.
MOG-specific AAbs trigger/aggravate clinical disease
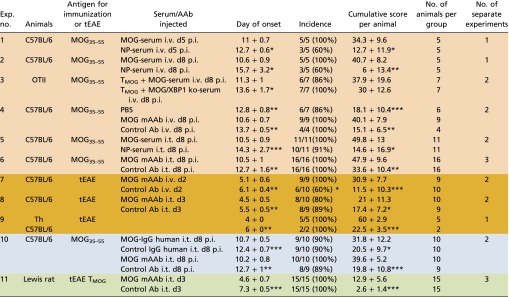 |
Data are presented as mean ± SD. For the day of onset and the cumulative score per animal, the result of the statistical test (Mann–Whitney U test) is indicated against the group receiving MOG AAbs. Differences in the incidence are calculated using the χ2 test. *P < 0.05, **P < 0.01, ***P < 0.001. The cumulative score per animal is calculated as the area between the clinical score curve and the x axis from every animal in the group over the entire observation period, which was kept constant for all animals of all groups within the experiment. The color code is as follows: orange, experiments including injection of serum or MOG mAAb; brown, transfer-EAE in mouse; blue, experiments including human IgG; green, transfer-EAE in Lewis rat. MOG35–55, MOG peptide amino acids 35–55; MOG mAAb, monoclonal MOG-specific antibody; tEAE, transfer EAE.