
Table S3.
Neither beta amyloid Abs and irrelevant immune complexes nor MOG AAbs in the context of S100β-specific T cells aggravate clinical disease
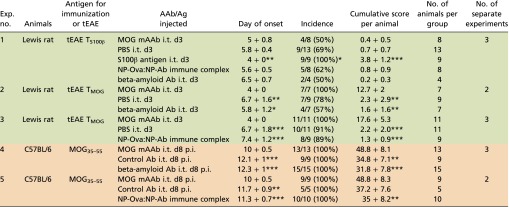 |
Data are presented as mean ± SD. For the day of onset and the cumulative score per animal, the result of the statistical test (Mann–Whitney U test) is indicated against the group receiving MOG AAbs. Differences in the incidence are calculated using the χ2 test. *P < 0.05, **P < 0.01, ***P < 0.001. The cumulative score per animal is calculated as the area between the clinical score curve and the x axis from every animal in the group over the entire observation period, which was kept constant for all animals of all groups within the experiment. The color code is as follows: green, transfer-EAE in Lewis rats including injection of immune complexes, mAAb, or Ag; orange, mouse experiments including injection of immune complexes or mAAb. MOG mAAb, monoclonal MOG-specific antibody; MOG35–55, MOG peptide amino acids 35–55; NP-Ova:NP-Ab immune complex, immune complex consisting of NP-ovalbumin complexed to NP-specific monoclonal antibodies; tEAE, transfer EAE.