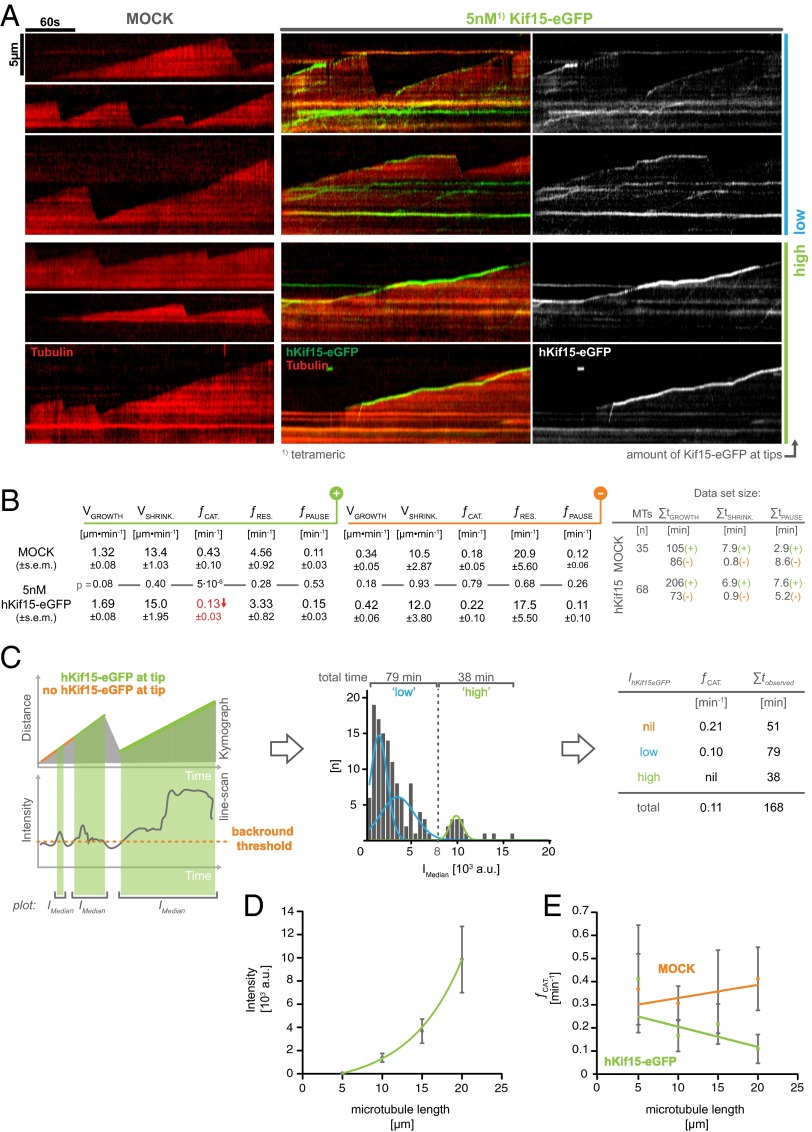
Fig. 2.
hKif15 motors cooperate to suppress catastrophe at microtubule plus-ends. (A) Kymographs showing the dynamicity of microtubule plus-ends in the absence (Left, MOCK) or presence of 5 nM Kif15-eGFP (Right) and 1.7 mM ATP. Two examples of each “low” and “high” amounts of plus-end–tracking motors are shown. (B) A global analysis of microtubule dynamicity parameters in the absence and presence of 5 nM hKif15-eGFP, subdivided into results for the plus-end (green) and the minus end (orange). V, velocity; f, frequency; t, time. The SE of the mean for each value is given and was calculated from the mean of the respective values per microtubule. Values are averages from multiple chambers. (C, Left) Scheme visualizing the procedure to subsample data for a correlation between the intensity of plus-end–tracking hKif15-eGFP particles and the catastrophe frequency at the microtubule plus-ends. See hKif15 Motors Cooperate to Inhibit Microtubule Catastrophe for a more detailed description. (Middle) Frequency distribution of median intensities (over time) of plus-end–tracking hKif15-eGFP motors (coherent phases >5 seconds). Due to the split intensity distribution, data showing end-tracking motors were subdivided into phases with “low” (<8,000 arbitrary units) and “high” (>8,000 arbitrary units) end-tracking motor amounts. (Right) The catastrophe frequency for the categories defined in the Middle panel. (D) Graph depicting the average hKif15-eGFP intensity tracking the plus-end during a microtubule growth phase in dependency on the average microtubule length during that growth event. Data are binned in 5-µm steps. Error bars indicate the SE of mean. (E) Graph showing the correlation of catastrophe events and the average microtubule length during a growth phase. The green linear fit represents measurements in the presence of 5 nM hKif15-eGFP, and the orange linear fit describes the behavior in a MOCK setup. Data are binned in 5-µm steps. Error bars indicate the SE of mean.

