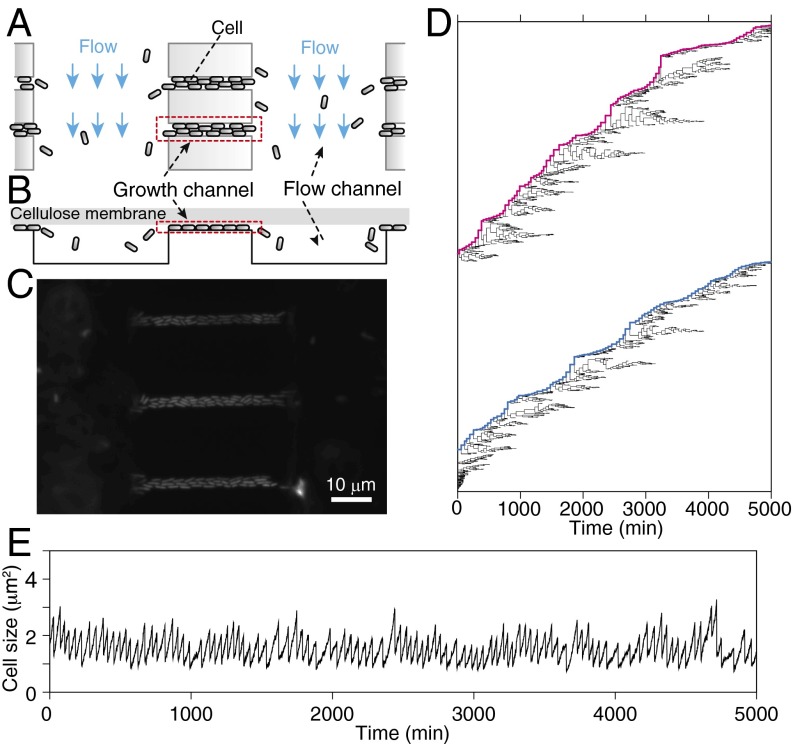
Fig. 2.
Single-cell growth measurement with dynamics cytometer. (A) Schematic drawing of the dynamics cytometer. In this device, we used the two types of microchannels etched on a coverslip. The narrow and shallow “growth channels” can harbor 25∼40 cells for time-lapse observation. The proliferation of the cells in the growth channels ejects a portion of the cells to the wide and deep “flow channels.” The flow in the flow channels removes the cells from the device. (B) Cross-section view of A. The channel region is covered by a flat semipermeable cellulose membrane with both ends of the flow channels left open to introduce medium flow (see also SI Appendix, Fig. S1C). The membrane restricts the cells to grow in a monolayer within the growth channels, which facilitates cell detection in image analysis. (C) A micrograph of E. coli in the device. (D) Single-cell pedigree of a population of E. coli (F3 rpsL-gfp strain) in a constant environment for 5,000 min (∼100 generations). The bifurcations of the lines indicate cell division, and the end points indicate cell removal from the growth channels. The magenta and blue lines indicate the single-cell lineages that remained in the growth channels for 5,000 min. The trees are obtained from the population proliferating in a single growth channel under a constant flow of M9 minimum medium supplemented with 0.2% glucose at 37 °C. (E) The time course transitions of cell size along the long single-cell lineage. This lineage corresponds to the top lineage in D. See also SI Appendix, Figs. S1–S5.

