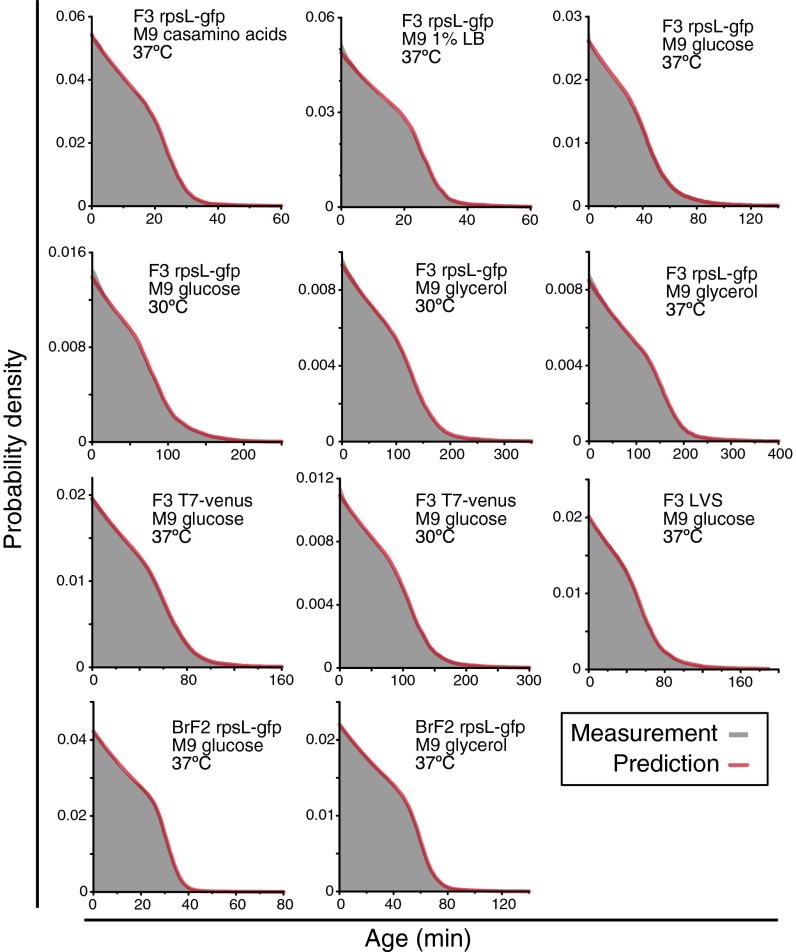
Fig. 4.
Comparison of age distributions between measurements and theoretical predictions. The gray distributions represent the experimentally measured population age distributions, and the magenta curves the theoretical predictions from the generation time distribution based on the relation [2]. Strain and culture conditions are indicated in each panel.

