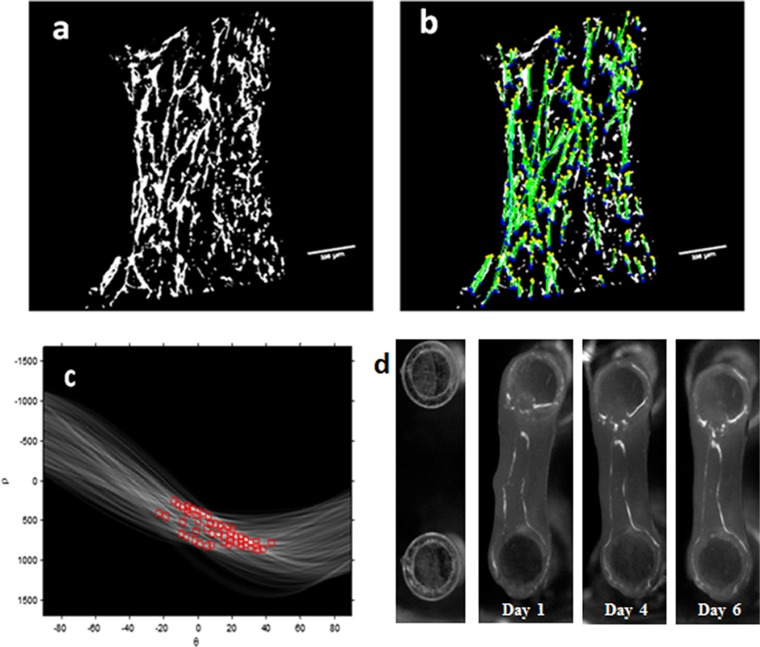
Fig. S2.
Vessel structure orientation and cell force estimation. Vessel orientation was analyzed using Matlab. The threshold was set to the binary image (A), and the image was segmented into objects. By using the Hough transform, lines were detected in the image (B). For each line, an angle (θ) and distance (ρ) from the origin were determined. The line angle distribution between −90 and +90° was then determined (C). The average number of objects in specific angle intervals was then estimated. (D) PDMS µpost deflections during the experiment days. Shown is the top view of the µpost heads.

