Fig. S1.
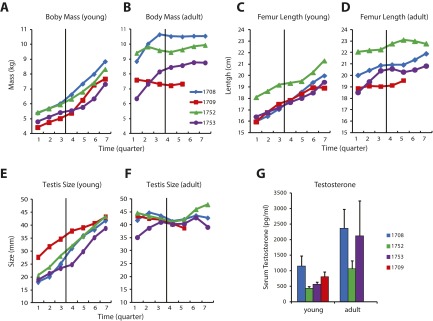
Developmental profile. (A) Body mass of each monkey depicted as a function of time (in quarters of a year) in the young stage. Data are aligned to the onset of recordings (vertical line). Data shown have been filtered with a three-point, triangular filter. (B) Body mass for the same subjects, now aligned relative to the onset of recording in the adult stage. (C and D) Femur length, presented in the same fashion as in A and B. (E and F) Testis size (length of longer dimension), presented in the same fashion as in A and B. (G) Serum testosterone concentration. Average values (and SEM) of three measurements around the onset of recordings in the young and adult stages are shown.

