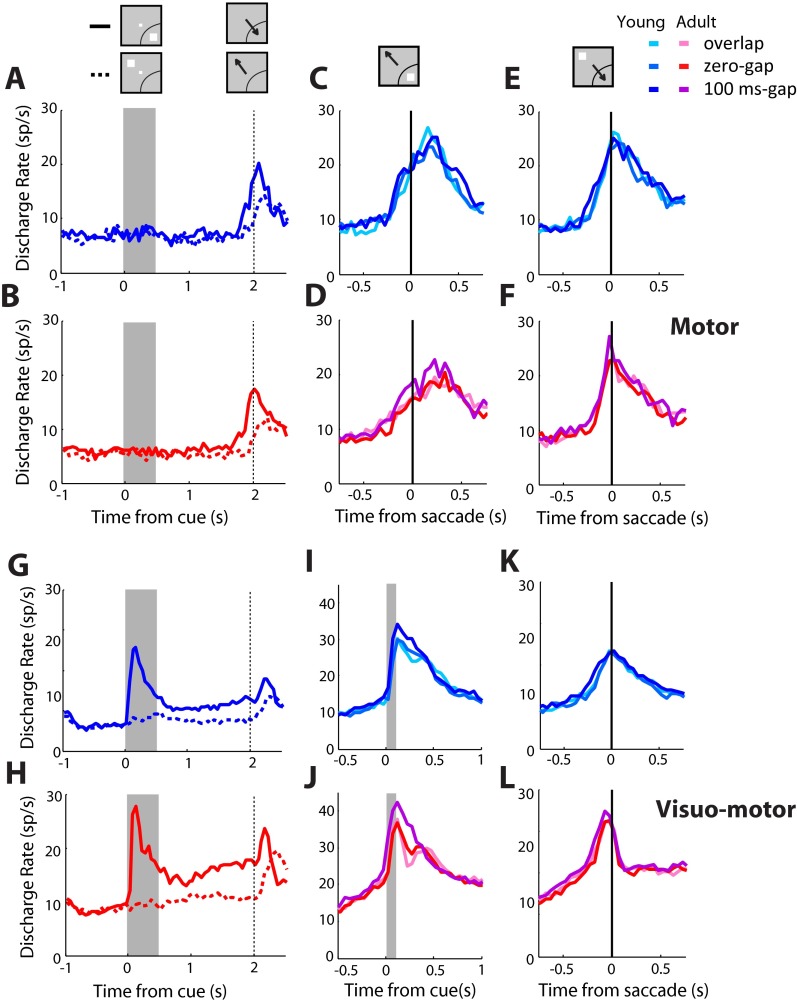
Fig. S3.
Activity of visual, motor, and visuomotor neurons. (A) Average population peristimulus time histogram for neurons with motor but not visual activity, tested with the ODR task in the young stage (n = 55). (B) As in A, for the adult stage (n = 68). (C–F) Average activity for the same neurons as in A and B in the antisaccade task. Activity is synchronized to the onset of the saccade (indicated as a vertical line). (G) Average population peristimulus time histogram in the ODR task for neurons that exhibited visual and motor-related activity in the young stage (n = 160). (H) As in G, for the adult stage (n = 215). (I–L) Average activity for the same neurons as in G and H in the antisaccade task. Activity is synchronized to the stimulus presentation in I and J and to onset of the saccade in K and L.

