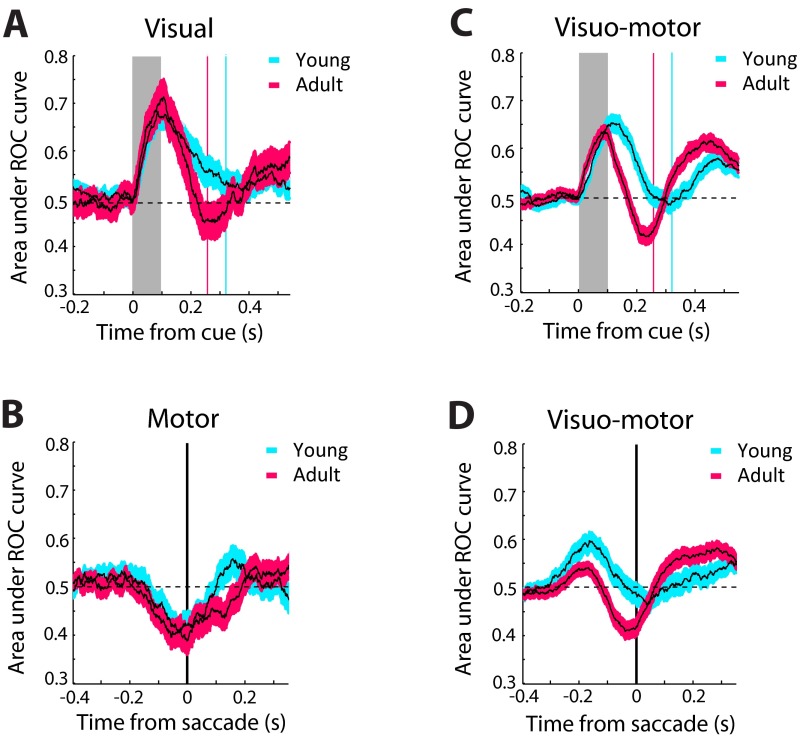
Fig. S7.
ROC analysis for visual and visuomotor neurons. (A) Area under ROC curve comparing the distribution of firing rates for the conditions with the stimulus in the receptive field and the saccade in the receptive field in the overlap variant of the antisaccade task. Average area under the ROC curve values are shown for neurons with pure visual responses in the young stage (n = 53) and adult stage (n = 38) in successive 100-ms windows, stepped every 10 ms, synchronized to the onset of the stimulus (gray bar). Blue and red vertical lines represent the mean times of saccade onset in this task. (B). Average area under the ROC curve values for neurons with purely motor responses in the young stage (n = 55) and adult stage (n = 68) in the overlap variant of the antisaccade task. Data are synchronized to the time of saccade onset (vertical line) (C). Average area under the ROC curve values for neurons that exhibited visual and motor-related activity in the young stage (n = 160) and the adult stage (n = 215) in the overlap variant of the antisaccade task. Data are synchronized to the onset of the stimulus (gray bar). (D). Area under the ROC curve for the same neurons as in C, now synchronized to the saccade.

