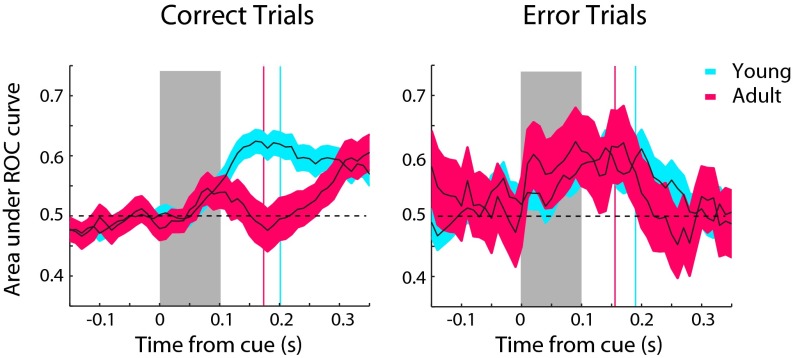
Fig. S8.
ROC analysis in correct and error trials. Area under ROC curve comparing the distribution of firing rates for the conditions with the stimulus in the receptive field and the saccade in the receptive field in the 100-ms gap variant of the antisaccade task. Average ROC area values are shown for neurons in the young stage (n = 110) and adult stage (n = 51) in successive 100-ms windows, stepped every 10 ms, synchronized to the onset of the cue (time 0). Values greater than 0.5 are indicative of neurons generating a greater response for a stimulus in the receptive field; values lower than 0.5 indicate greater response for a saccade toward the receptive field. Vertical lines represent mean reaction times in the task. Data are plotted from neurons with available error trials in each of the two conditions involving the cue appearing in the receptive field and out of the receptive field (Right). Only e2-type error trials are included here, involving an error toward the cue location. Correct trials from the same neurons are also shown (Left).

