Fig. 3.
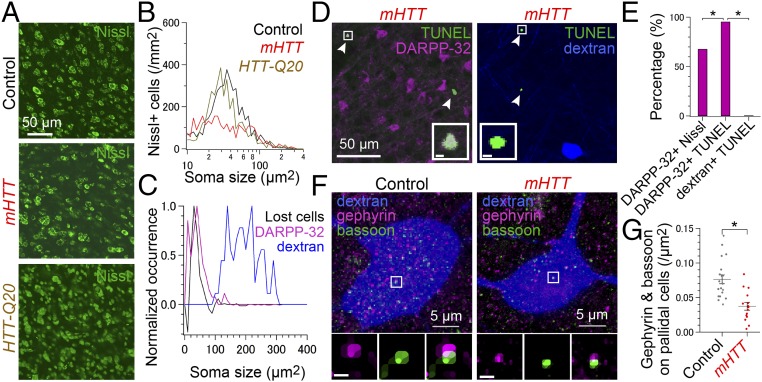
Cellular and synaptic deficits in area X of mHTT birds. Nissl-stained area X neurons (A) and their soma size histograms averaged across control birds (black, n = 4), mHTT birds (red, n = 4), and HTT-Q20 birds (orange, n = 2) (B). (C) Peak-normalized soma size histogram of the difference between black and red traces in B (black, indicating lost cells), DARPP-32–positive MSNs (magenta, n = 2 birds) and dextran-labeled pallidal neurons (blue, n = 2 birds). (D) TUNEL-positive dying neurons (green, arrowhead) in mHTT birds were DARPP-32–positive MSNs (Left, pseudocolored magenta) but not dextran-labeled pallidal neurons (Right, pseudocolored blue). (Insets) Squared region. (Scale bars, 2 μm.) (E) Fraction of DARPP-32–positive MSNs was greater in TUNEL-positive neurons than in Nissl-positive neurons [χ2(3) = 25.7, P < 0.001], suggesting the preferential degeneration of MSNs. The fraction of DARPP-32–positive MSNs was greater than dextran-labeled pallidal neurons in TUNEL-positive neurons [χ2(3) = 101.0, P < 0.001] in area X of mHTT birds. (F) Maximum-projected images showing inhibitory synapses detected as colocalization of gephyrin (pseudocolored magenta) and bassoon puncta (green) on a dextran-labeled pallidal neuron (pseudocolored blue) in a control bird (Left) and mHTT bird (Right). (Insets) Median-filtered images of gephyrin (Left), bassoon (Center), and merged (Right) in the squared region. (Scale bars, 0.5 μm.) (G) Reduced inhibitory synapses on pallidal neurons in mHTT-Q94 birds [control: n = 19 cells from two birds, mHTT-Q94: n = 15 cells from two birds; t(32) = 4.517, P < 0.001]. *P < 0.050 (see also Fig. S4).

