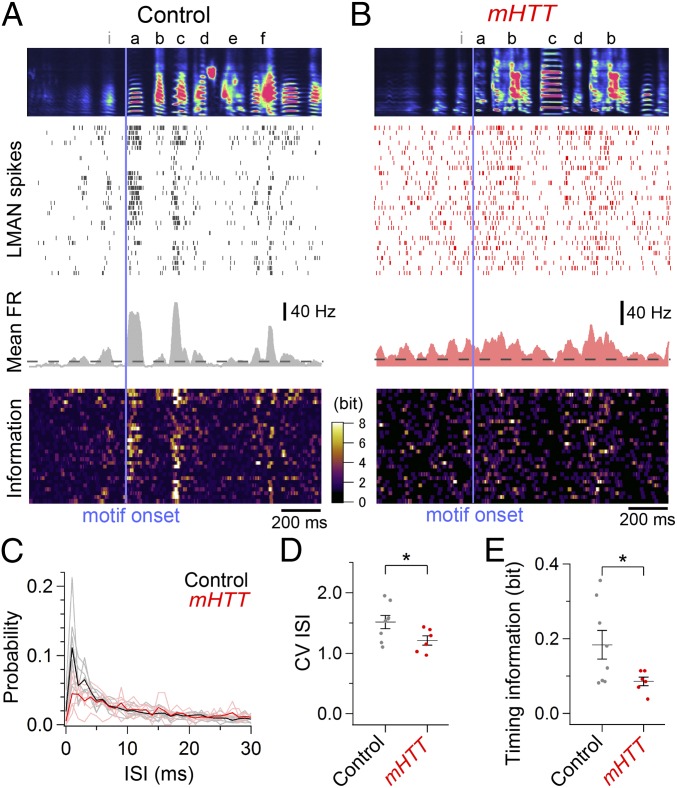
Fig. 5.
Abnormally regular LMAN activity with less timing information in mHTT birds. LMAN activity was aligned to the onset of the dominant song motif (vertical bar) in a control bird (A) and mHTT bird (B), showing averaged spectrogram of the first 30 renditions of songs that includes the dominant song motif (Top), corresponding spike rasters of LMAN activity (Upper Middle), mean FR across renditions (Lower Middle), and information on the cell’s activity as in Fig. 4 A and B (Bottom). (C) Mean ISI histogram of LMAN activity in control (black, n = 8 cells from three birds) and mHTT (red, n = 6 cells from three birds) birds. Bright lines indicate individual data. Compared with control birds, LMAN activity in mHTT birds exhibited a reduction in the CV of the ISI (D) and timing information (E) [CV ISI: t(12) = 2.286, P = 0.041; timing information: t(12) = 2.304, P = 0.040]. *P < 0.050 (see also Figs. S5 and S7).

