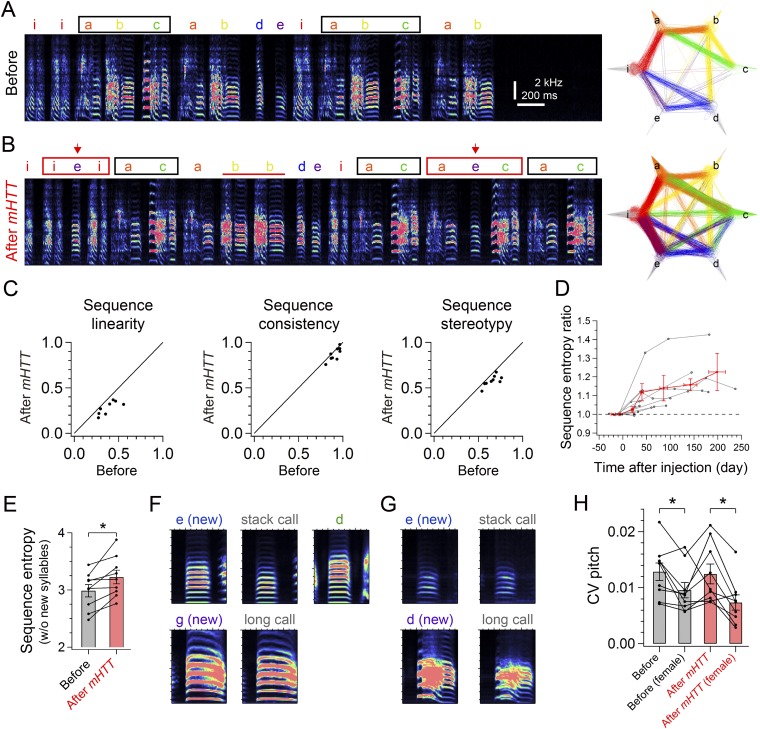
Fig. S2.
Behavioral data from mHTT birds. Spectrogram of a representative song bout (Left) and a syllable transition diagram (Right) from a bird recorded 8 d before (A) and 137 d after (B) bilateral injection of mHTT in area X. Note that the dominant song motif (black square) was reduced from three to two syllables after injection, but syllable transitions became variable with irregular syllable repetitions (red horizontal bar) and syllable insertions (red arrow), forming new syllable transitions (red square). (C) Decrease in linearity [71.9 ± 4.2%; t(8) = 6.656, P < 0.001], consistency [95.7 ± 1.5%; t(8) = 2.941, P = 0.022], and stereotypy [88.4 ± 2.3%; t(8) = 5.152, P = 0.002] after injection of mHTT. (D) Long-term change of sequence entropy in mHTT birds (gray) and its average in each time window (red), shown normalized to the value at 1–15 d before injection. (E) Sequence entropy calculated with song bouts that did not include newly incorporated syllables [t(8) = 3.558, P = 0.007]. (F) Mean spectrograms of 30 renditions of syllables and calls of the mHTT bird shown in Fig. 2 A–D. A newly incorporated syllable (Top Left, e) had different spectral features from a stack call (Top Middle) or an original syllable (Top Right, d). (Bottom) Another newly integrated syllable (g) was highly similar to a long call. Each panel shows a 200-ms spectrogram (from 50 ms before to 150 ms after the vocal onset) with the frequency range of 0.5–10 kHz. (G) Same as in F, but with data from the other mHTT bird shown in Fig. 6. A newly integrated syllable (Top Left, e) was highly similar to a stack call (Top Right). Another newly incorporated syllable (Bottom Left, d) had slightly different spectral features from a long call (Bottom Right). (H) CV pitch of syllables before and after mHTT injection in the presence or absence of a female [effect of injection: F(1,24) = 0.72, P = 0.402; effect of a female: F(1,24) = 7.54, P = 0.010; interaction: F(1,24) = 0.35, P = 0.561]. Error bars indicate SEM. *P < 0.050.

