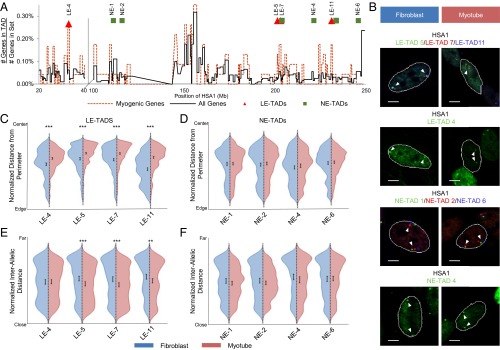
Fig. 3.
Behavior of myogenic gene-enriched domains of HSA1 during MyoD-induced myogenesis. (A) Relative gene density map for the regions of interest on HSA1 denoting the positioning of the LE-TADs and NE-TADs assayed. (B) Example FISH images of cells transduced with either GFP (fibroblast) or MyoD (myotube), showing the positioning of the LE-TADs or NE-TADs. (C) Violin plots of the normalized distances from the nuclear perimeters of the LE-TADs. (D) Violin plots of the normalized distances from the nuclear perimeters of the NE-TADs. (E) Violin plots of the normalized distances between homologous alleles of the LE-TADs. (F) Violin plots of the normalized distances between homologous alleles of the LE-TADs. Significance was assayed by the two-sample t test with unequal variance for distance from the nuclear perimeter and the Wilcoxon rank-sum test for interallelic distance (*P < 0.05; **P < 0.005; ***P < 0.0005). Error bars are 95% CIs of the mean. n >400 individual alleles and n >200 pairs. Results represent a pooling of the raw data from a combination of at least two biological replicates. (Scale bar: 5 μm.)

