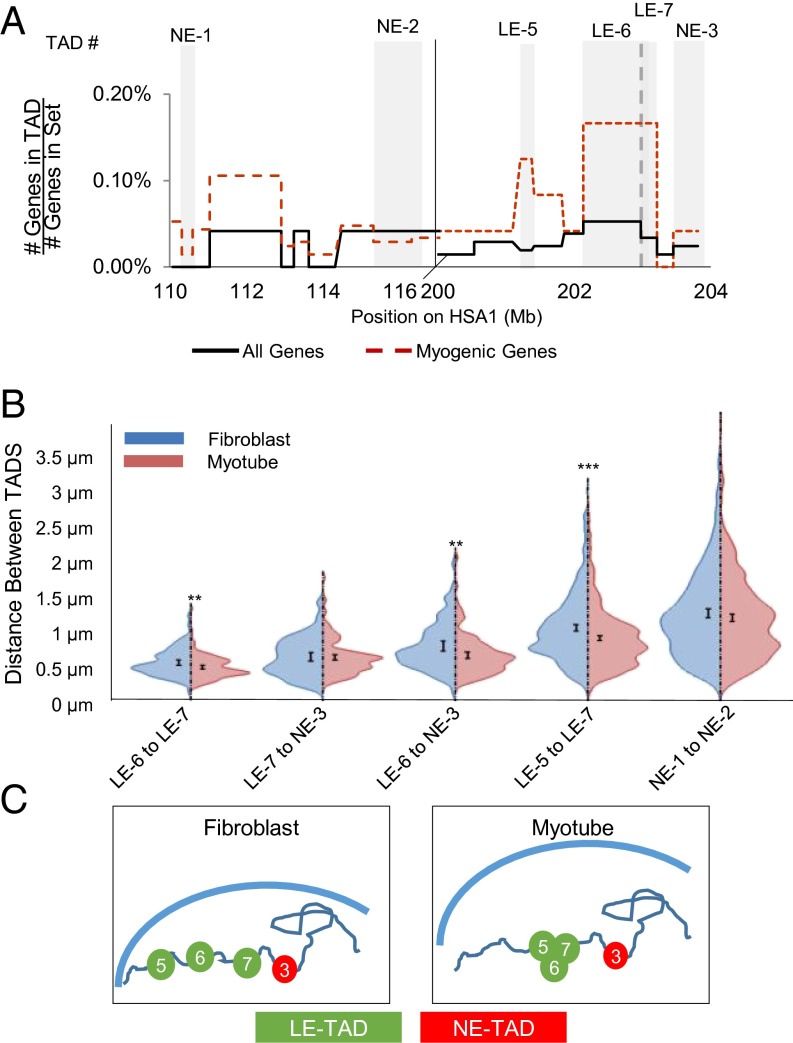
Fig. 4.
Behavior of LE-TADs on a single HSA1 during myogenesis. (A) Gene density map of the TADs interrogated for pairwise interactions. Gray backgrounds highlight the TADs assayed. (B) Violin plots of the pairwise distances, in microns, between TADs of interest in GFP (fibroblast)-expressing or MyoD (myotube)-expressing cells. n >90 individual alleles. (C) Model of local domain positioning changes in response to differentiation, showing all of the TADs between LE-TAD 5 and LE-TAD 7 clustering in myotubes while the distance between LE-TAD 7 and NE-TAD 3 remained static. Significance was assayed by the two-sample t test with unequal variance (*P < 0.05; **P < 0.005; ***P < 0.0005). Error bars represent 95% CIs of the mean.

