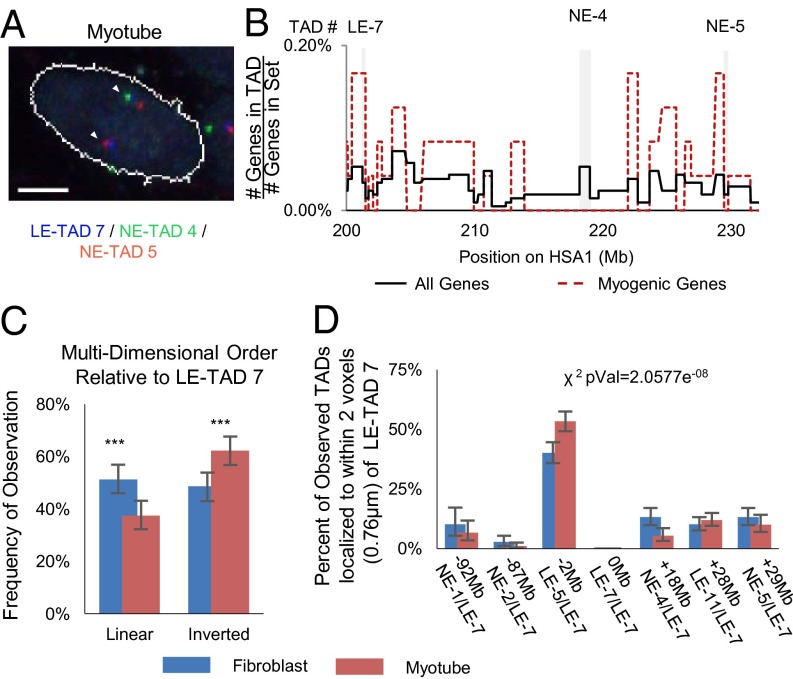
Fig. 5.
Intrachromosomal LE-TADs distances are not a function of linear distance. (A) Example FISH images of a cell expressing MyoD, showing three domains. The linearly distal domains, NE-TAD 5 (red) and LE-TAD 7 (blue), are proximal, and NE-TAD 3 (green) is looped out. (B) Gene density map of the chosen TADs highlighted with gray backgrounds. (C) Quantification of the frequency at which the three TADs (LE-7, NE-3, and NE-4) are found in 3D distances predicted by linear sequence. Significance was assayed by the two-sample t test with unequal variance (*P < 0.05; **P < 0.005; ***P < 0.0005). Error bars represent 95% CIs of the mean. n >300 clusters. (Scale bar: 5 μm.) (D) Percentage of observations in which the TAD denoted on the x-axis is found within two voxels (0.7898 μm) of LE-TAD 7. The reported χ2 value represents the probability that the myotube and fibroblast values are from the same underlying distribution.

