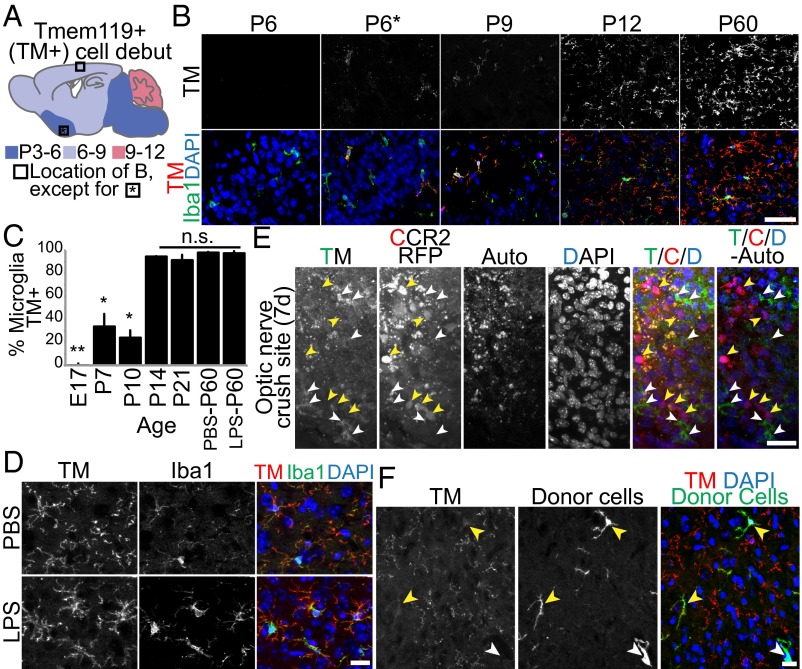
Fig. 3.
Tmem119 is a developmentally regulated but stable microglia marker. (A) Schematic showing timing of Tmem119 IR in microglia. (Scale bars, 50 μm.) (B) Tmem119 and Iba1 IR in brain sections from different ages (maximum intensity projection, MIP). (C) Percent Tmem119+ cells by age and post-LPS treatment, using ECD mAb. Bars show mean± SEM *P < 0.01 P14–P60; **P < 0.01 all ages; n.s., no significant differences by ANOVA with Tukey HSD. n = 2 experiments of two animals (P10 and older) or one litter (under P10) for each age/condition, except for P7 (n = 3), P21 (n = 3), P60 (n = 8, 3 PBS injected pooled with naïve). (D) Tmem119 and Iba1 IHC 3 d post-PBS or LPS reveals no gross reduction in Tmem119 IR (MIP). (Scale bars, 20 μm.) (E) Representative MIP of optic nerve crush site in 120 d CCR2-RFP+/− mouse. Tmem119 (T) IR (white arrows) and CCR2-RFP (C, yellow arrows) detected at the crush site. There are no Tmem119+RFP+ cells. Autofluorescence channel (auto) is digitally subtracted from merge (T/C/D) to differentiate microglia (green) from infiltrating cells (red) in debris-filled crush site. (Scale bars, 25 μm.) (F) GFP+ donor BM cells in the CNS 6 mo posttransplant are Tmem119− in the parenchyma (yellow) and out (white) despite the presence of Tmem119+ microglia. (Scale bars, 20 μm.) See also SI Appendix, Fig. S3.

