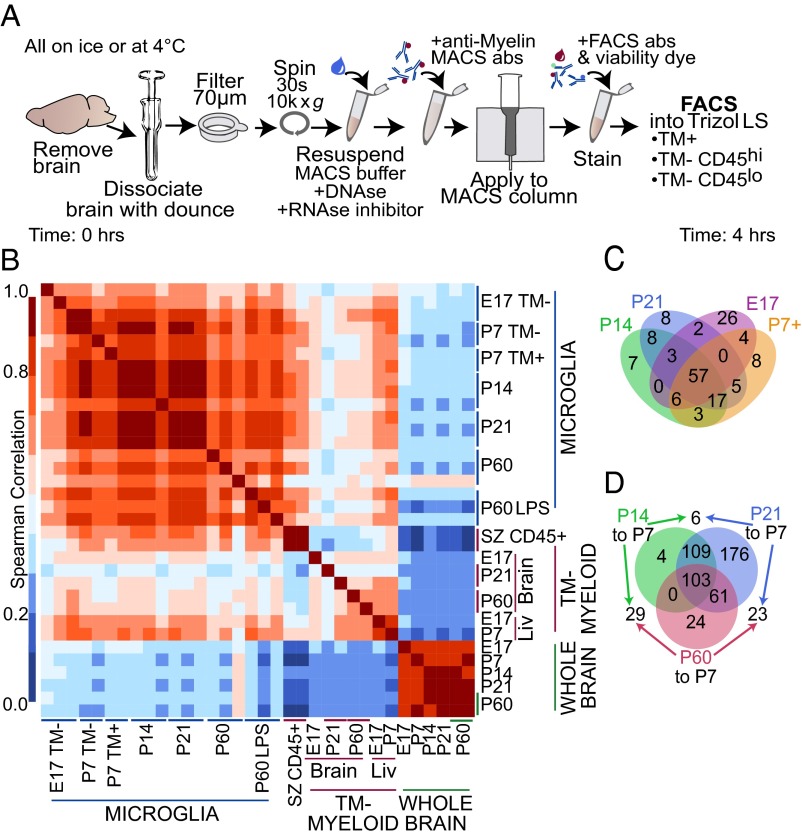
Fig. 4.
Isolation and RNAseq profiling of microglia using Tmem119 IR. (A) Schematic showing streamlined microglia isolation procedure for minimizing baseline microglia reactivity and death. Abbreviations: abs, antibodies; CV, column volumes; TM, Tmem119. (B) Heatmap of Spearman correlation between individual microglia, myeloid, and whole-tissue RNAseq replicates for genes expressed FPKM > 5. (C) Four-way diagram demonstrating top 100 expressed genes by microglia (Tmem119+ except for E17) at each age. (D) Venn diagram showing number of differentially expressed genes between P7 Tmem119+ and mature microglia (P14, P21, P60). Black numbers outside diagram represent the few differentially expressed genes between these time points. Diagrams adapted from jVenn (58). See also SI Appendix, Fig. S4 and Dataset S1.

