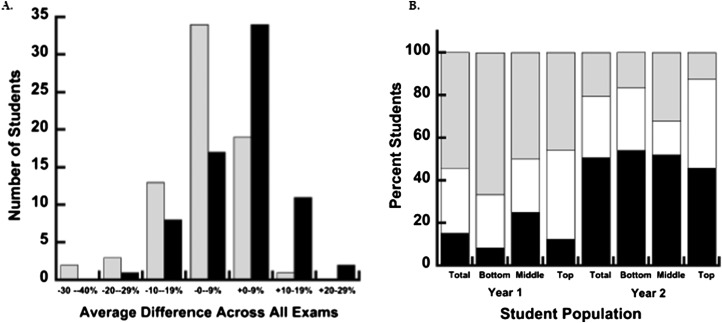
Figure 1.
Comparsion of the average difference between student performance on examination questions related to module topics vs all examination questions. (A) Results for students in year 1(no modules) are represented by gray bars and students in year 2 (with access to modules) are represented by black bars. (B) Population breakdown by final course grade. (Total, top 33%, middle 33%, bottom 33%). The percent of students in each group with a positive (black), neutral (white), negative (gray) performance are shown for year 1 and year 2.

