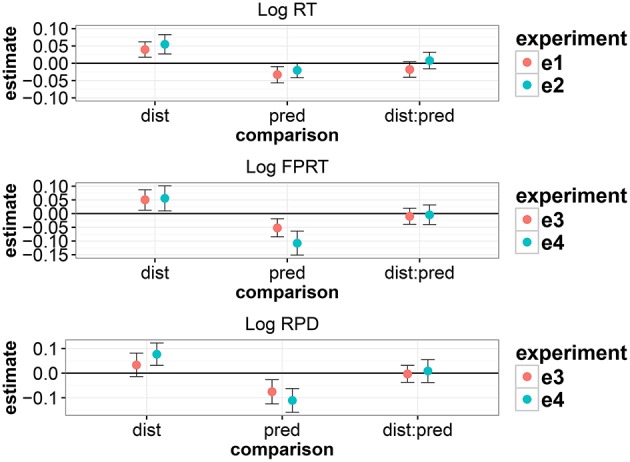
Figure 5.

Summary of the magnitudes of effects (derived from the linear mixed models) across the four experiments. The error bars show 95% uncertainty intervals and show the range within which we can be 95% certain that the true parameter lies given the data.
