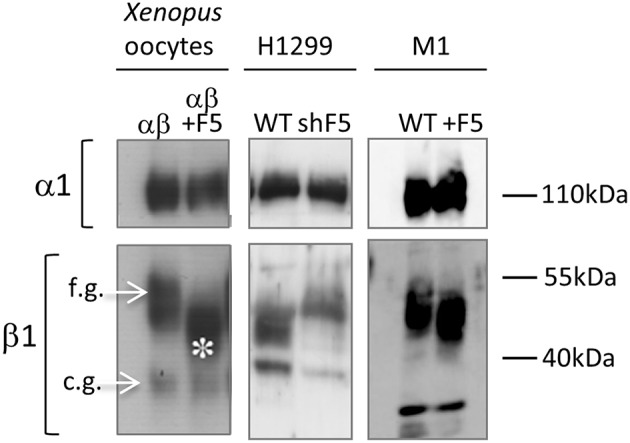
Figure 2.

Expression of FXYD5 effects β1-Na+/K+-ATPase glycosylation. Western blot of microsomes: left panel- Xenopus oocytes, injected with αβ or αβ/FXYD5, middle panel- H1299 WT cells and shFXYD5 cells (shF5), right panel- M1 WT cell and FXYD5 transfected cells (+F5). β1-Na+/K+-ATPase is represented by two bands, one for fully glycosylated (f.g) and the other for core glycosylated (c.g.) form (marked with arrows). FXYD5 expression reduces glycosylation level of fully glycosylated form (asterisk). The figure was originally published in (Lubarski et al., 2007, 2011).
