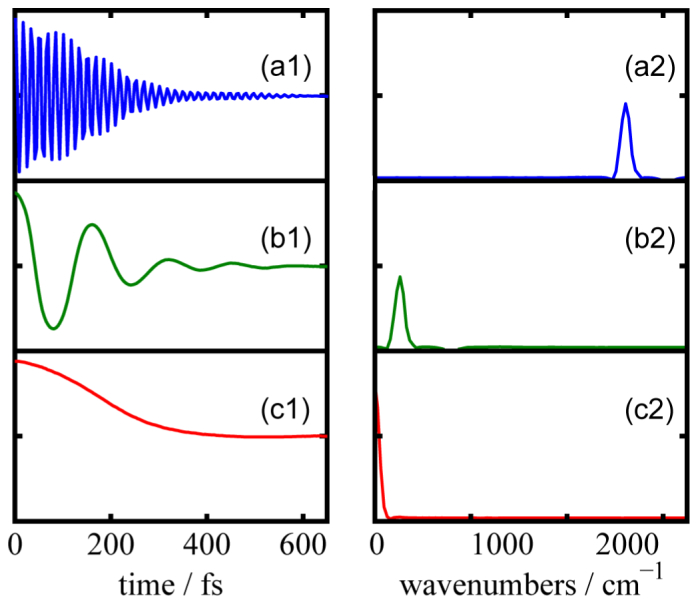
Fig. 3.

(a1-c1) Measured one-sided interferograms, generated using rotating frame frequencies of (a) 0 (b) 1800 and (c) 2000 cm−1, along with their respective Fourier transforms (a2-c2). Phase cycling shifts the apparent carrier frequency so that fewer data points are needed to sample the interferogram.
