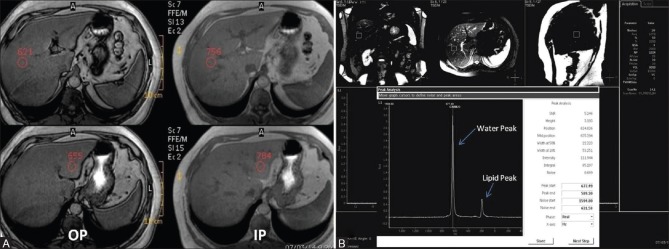
Figure 2 (A and B).
Dual phase MRI (A) and MR Spectroscopy (B) in a donor with grade I liver steatosis (Histopathological fat fraction 20%). (A) Dual in and opposed phase MRI demonstrates significant signal drop in hepatic parenchyma on opposed phase images on comparison with in phase images with HFF measuring 8.5% (B) Single voxel MR Spectroscopy reveals moderate sized lipid peak at 1.3 ppm (small arrow) with large water peak at 4 ppm (long arrow), HFF measuring 13.7%

