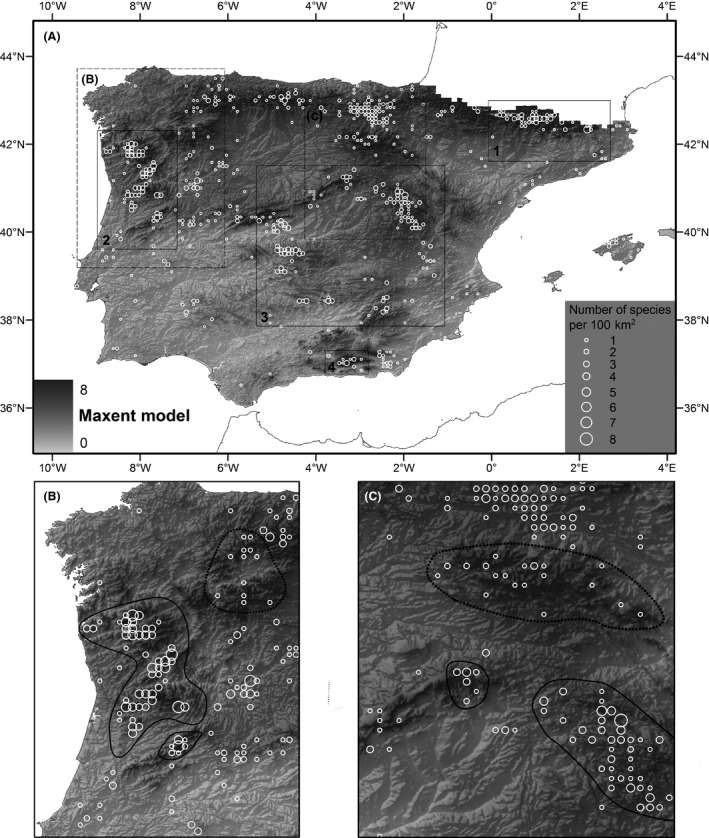
Figure 3.

Maxent richness model of Grimmia for the Iberian Peninsula. (A) Overlap between the richness model (background) and number of species recorded per 100 km2 pixel. (B) and (C) Examples of areas in the Iberian Peninsula for which the richest areas according to the Maxent model match (solid lines) and do not match (dotted lines) the richest areas with more taxa recorded in the natural history collections.
