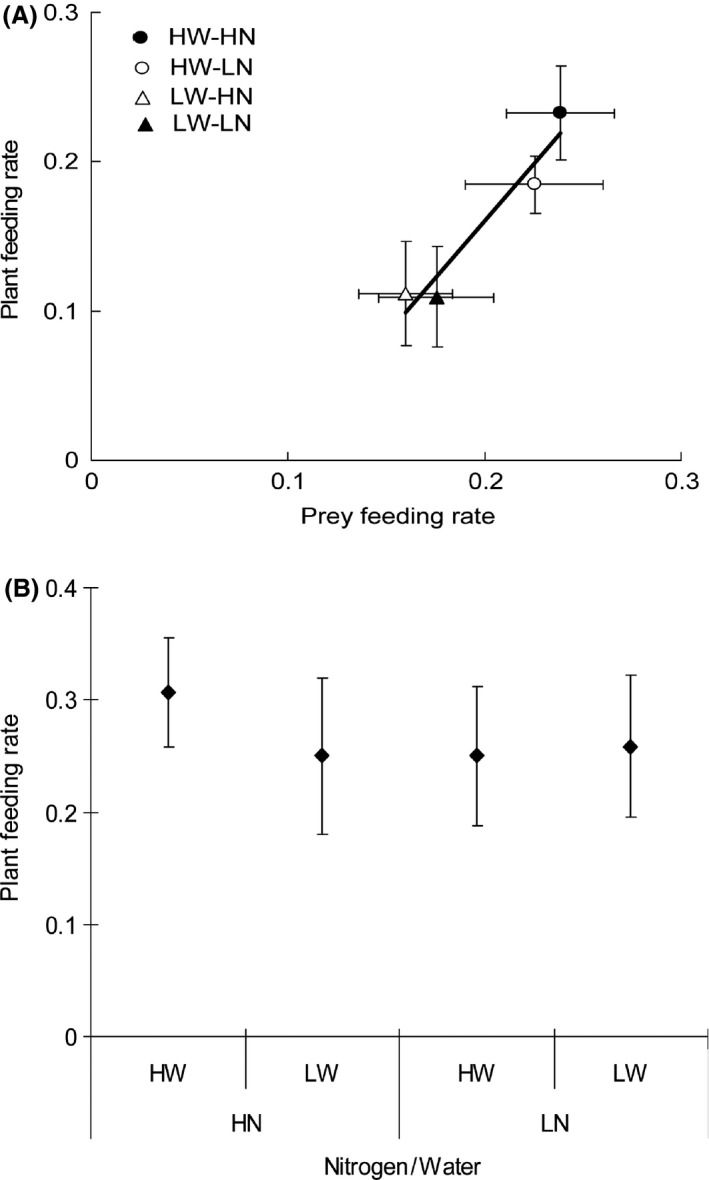
Figure 3.

Predator plant‐ versus prey feeding behavior observation in the arenas: (A) Relationship between average plant feeding and prey feeding rate (±SE, the solid line is a linear regression), and (B) average plant feeding rate (±SE), when plants were treated with high and low nitrogen inputs (HN and LN) in combination with high and low water inputs (HW and LW) in the absence of prey.
