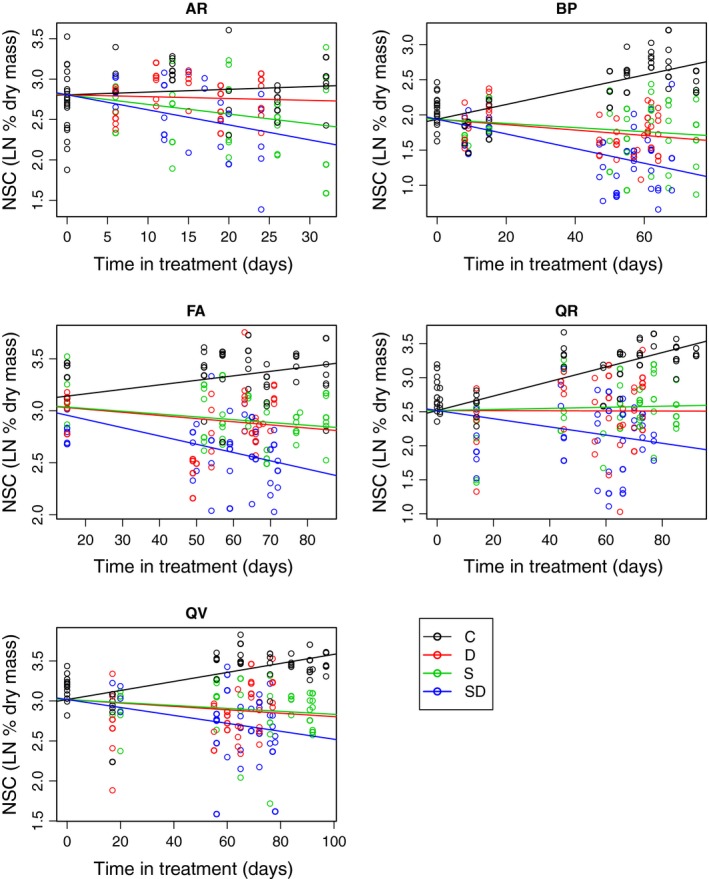
Figure 3.

Total nonstructural carbohydrate (NSC) concentrations in seedlings over time under five treatments: C = control (50% light, well‐watered), D = drought (50% light and no water), S = shade (<3% light, well‐watered), SD = shade + drought (<3% light, no water). Each point represents one seedling. Lines are best‐fit linear models for each treatment with a common intercept, and NSC concentrations are natural log transformed. Models include seedlings from a nonsignificant defoliation treatment that is pooled with other treatments.
